Terrestrial LIFT Instrument
LIFT-REM Fluorometer
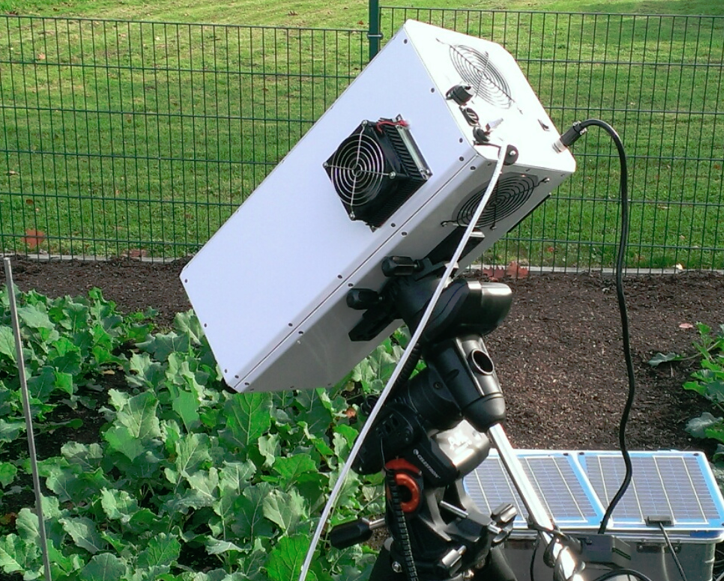
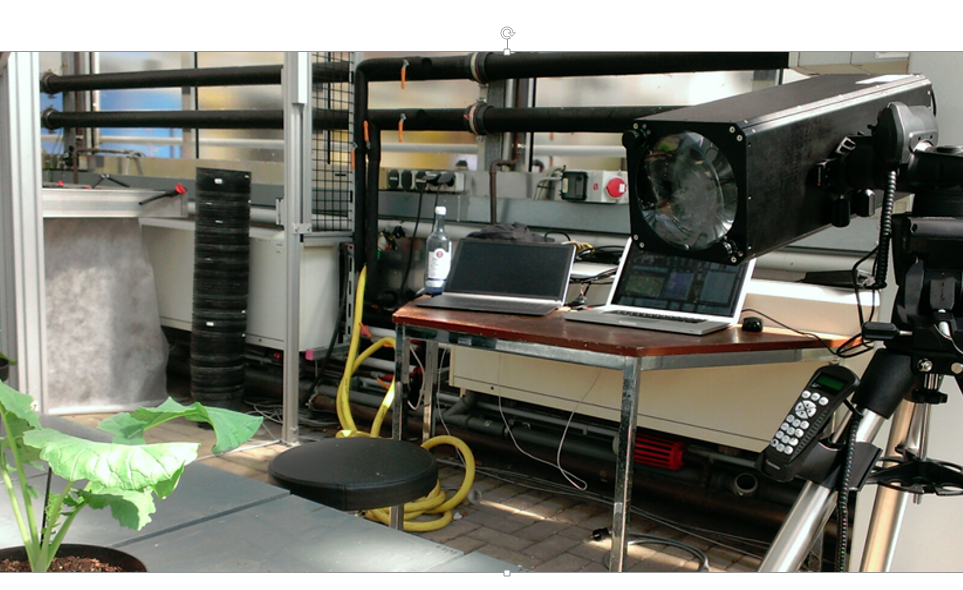
Soliense LIFT-REM fluorometer measures photosynthetic characteristics in higher plants, remotely, at a distance of up to 3 meters (1).
The instrument uses an array of software-controlled excitation light sources operating in pulse/DC mode to manipulate
photosynthetic status and to measure resulting changes in the fluorescence signal emanating from Photosystem II chlorophyll antenna.
The measured fluorescence transients are processed by the LIFT/FRR application software to quantify a range of biophysical
characteristics that determine photosynthetic performance of plants. The instrument is equipped with a pair of cameras, triggered by the LIFT excitation signal
to acquire information for 3-D reconstruction of the target image. In-line spectrometer is used to acquire reflectance spectra of the target.
Internal computer (Windows or Linux OS) controls instrument operation, performs data analysis and management.
Automatic target selection within instrument range is facilitated by use of LIFT-controlled motorized telescope tripod.

Specifications
Photosynthetic characteristics measured
- Functional and optical absorption cross section of
Photosystem II. - Yield of photosynthetic charge separation.
- Kinetics of photosynthetic electron transport.
- Probability of energy transfer between PSII reaction centers.
- Kinetics and amplitude of Non-Photochemical Quenching (NPQ) of chlorophyll fluorescence.
- PQ pool size based on the kinetics of electron transport(2).
- PSII acceptor side carotenoid quenching(2).
- PSII donor side P680+ quenching(2).
- Parameters describing the relationship between Electron Transport Rates (ETR) and irradiance such as initial slope, half-saturation level, and maximum electron transport rates:
- Using software-controlled light step protocols to acquire Rapid Light Curves (RLCs); requires 5 - 15 minutes measurement time
- Using LIFT/FRR Instantaneous Light Curves (ILCs)(2); requires ∼200 ms measurement time
- Photosynthetic responses to varying spectral light quality and light levels (State Transition, changes in PQ pool redox level).
(2) Properties measured exclusively by Soliense instruments
Remote Measurements Range
- Up to 3 meters using LED-based excitation source.
- Up to 5 meters in the new version of LIFT-REM instrument available 1-st quarter 2017.
- Up to 50 meters using laser-based light source (see the comment above regarding eye-safety concerns).
Spectral Range and Excitation Power
- 450 nm (monochromatic version), 450 nm, 470 nm, 510 nm, and 530 nm(3) (color version).
- Total excitation power of up to 18,000 μmol quanta m-2s-1 in pulse mode and 1,600 μmol quanta m-2s-1 in DC mode, both controlled from LIFT software.
- Integrated, in-line spectrometer, 325nm – 812 nm spectral range, for measuring target spectral reflectance signal.
(3) Selection of excitation wavelengths can be further customized to satisfy requirements for selective excitation of
different photosynthetic pigments
and can be tailored to user specifications.
LIFT-REM-1.0
- Size: 510 mm (length) x 220 mm (height) x 220 mm (width).
- Power consumption: 20 W max (with all CW illumination light sources at maximum).
- Power supply: external 19 V AC-DC power supply operating at 105 - 220V, 50-60Hz (provided). Can operate from 9-24V battery.
LIFT-REM-2.0
- Size: 390 mm (length) x 180mm (height) x 190 mm (width).
- Power consumption: 35 W max (with all CW illumination light sources at maximum).
- Power supply: external 19 V AC-DC power supply operating at 105 - 220V, 50-60Hz (provided). Can operate from 9-24V battery.
Base Unit (LIFT=REM-1.0
- One or four excitation channels with software-controlled wavelength selection and excitation power.
- Internal or external computer (Windows or Linux OS) for instrument communication, control, data processing, and data storage.
- Telescope stand with telescope control software.
- LIFT-FRR control software with free, unlimited software updates.
- External 110V - 220V AC/DC power supply.
- Shipping case.
Options
- LIFT-SPEC-1.0
Internal, in-line spectrometer for acquiring reflectance spectra from target area based on Horiba VS70 spectrometer design, 326 – 812 nm spectral range, Hamamatsu S1158- 1106 cooled CCD detector. Spectral resolution: 1 nm with 25 μm slit; 2 nm with 50 μm slit. - LIFT-CAM-1.0
Double camera system for 3D reconstruction of target image(4).
(4) ) Requires third-party software for 3D image reconstruction (not included)
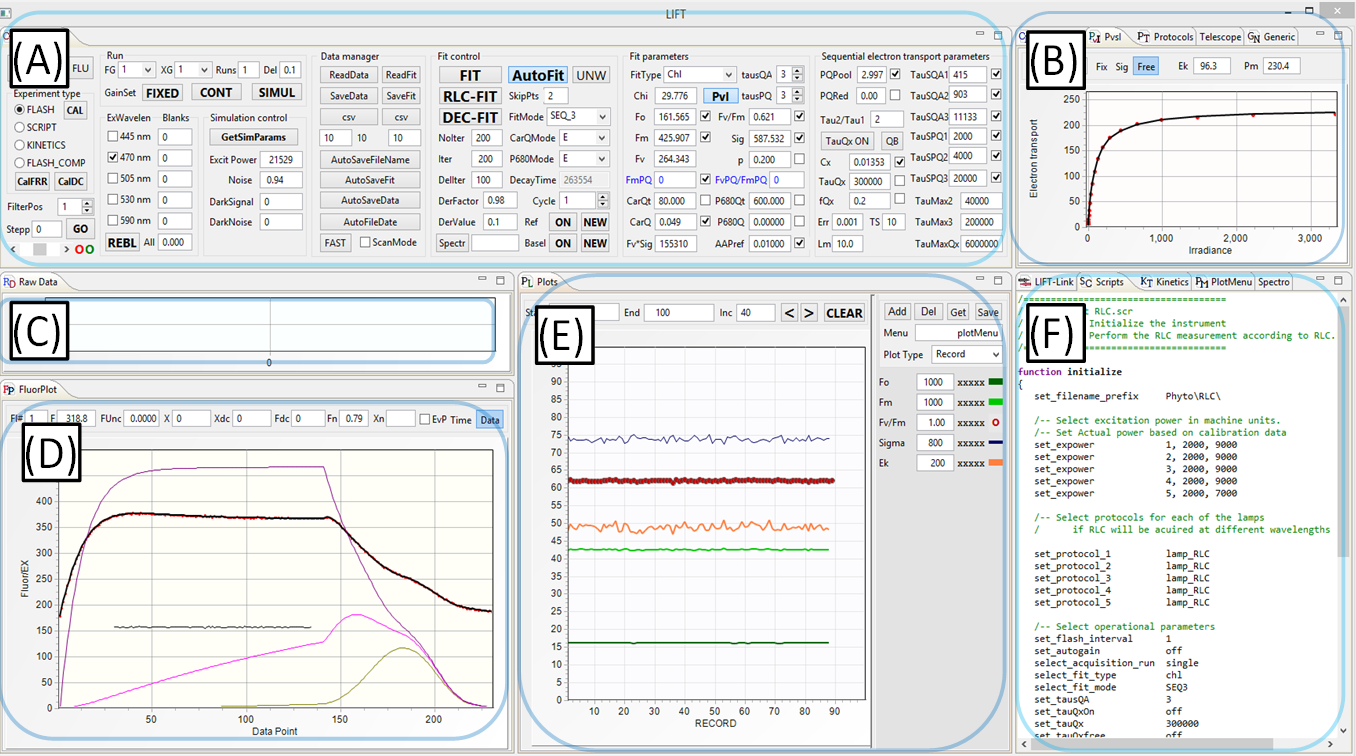
(A) Instrument Control panel
- Selection of operational mode, excitation channels, fitting models, and data management modes
- Initiation of the experiment and calibration procedures
- Initiation of data fitting procedures
(B) Calibration, Protocols, and PvsI panels
- Flash exitation parameters (number of flashlets, flashlet lenghth, flashlet timing)
- Initiation of the experiment and calibration procedures
- Control and display of RLC and ILC fitting procedure
(C) Raw Data Display panel
- Display of raw excitation signal and raw fluorescence signal, one datapoint/flashlet
- Display of raw shape of the excitation flashlets and corresponding fluorescence signal, digitized at 10MHz sampling rate
(D) Calibrated Data Display panel
- Calibrated excitation signal
- Calibrated fluorescence signal
- Noise signal
- Data fit display
- Redox level of QA, QB, and PQ Pool
- Display of total electrons entering and leaving the electron transport chain
(E) Data Plot panel
- Plots of the fitted data
- Plots menu (symbols and colors
- Plotting modes (records, date/time, depth)
- Plot update modes
(F) Communication, Scripts, Kinetics, Plot menu, and Spectrometer panel:
- Data communication control and monitoring
- Programming script for automating instrument operation(5)
- Programming scripts for DC light manipulation
- Plots layout and management
- Spectrometer control and spectrometer data display
(5)Script-based operation allows programming a sequence of measurements/experiments, including instrument initialization, selection of excitation protocols, data management, and fitting procedures.
Instrument Operation
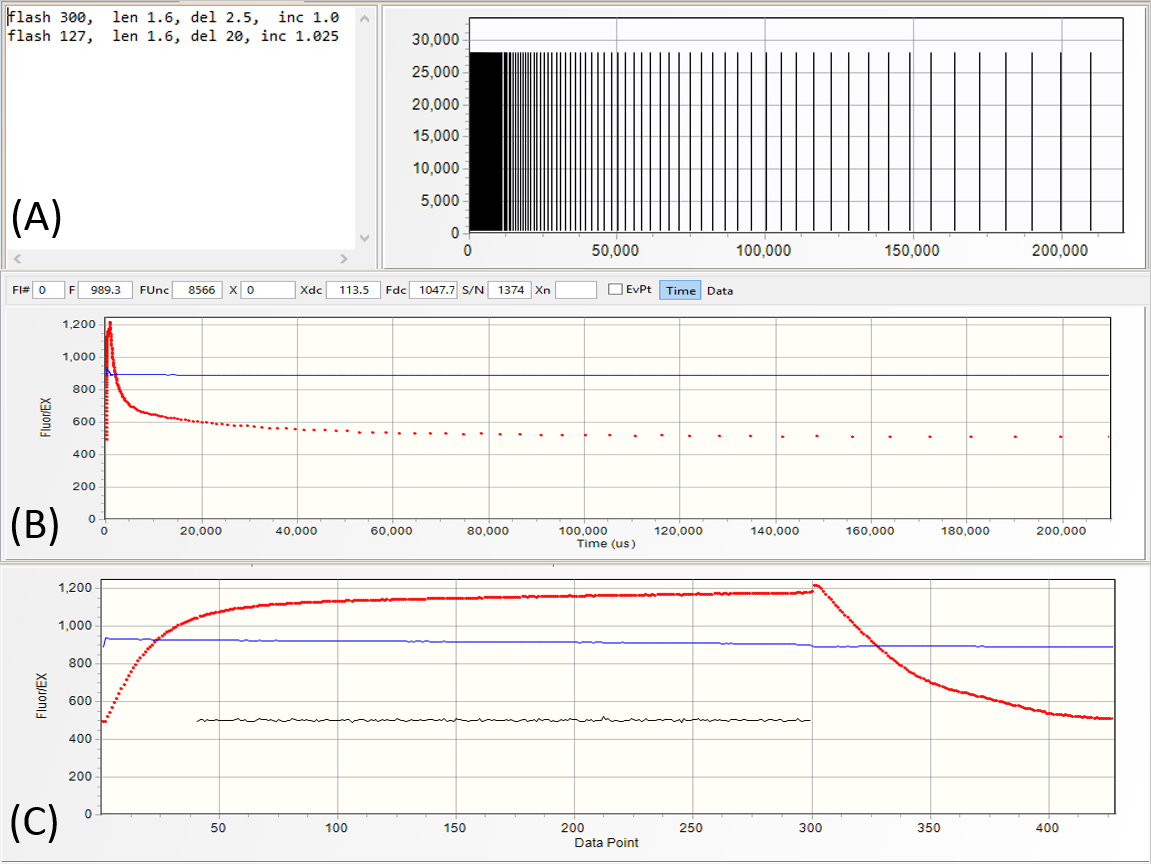
Excitation protocols define the number of flashlets and their timing in the excitation sequence.
They are specified in the editor section of the protocol panel (A).
Usually, LIFT/FRR excitation protocol consists of the saturation sequence, with flashlets applied at high repetition rates, as specified in the first line of the protocol:
flash 300, len 1.6, del 2.5, inc 1.0
- make 300 flashlets
- set flashlet length to 1.6 μs
- set flashlet interval to 2.5 μs
- keep flashlet interval constant,
followed by a relaxation sequence specified in the second line of the protocol:
flash 127, len 1.6, del 30, inc 1.025
- make 127 flashlets
- set flashlet length to 1.6 μs
- set initial flashlet interval to 20 μs
- increase interval by exponential factor of 1.025.
A graphical representation of the excitation protocol is displayed
in the graph section of the protocol panel. The fluorescence transient produced by this excitation protocol is shown as a function of time (B), and as a function of flashlet number
(C).
Depending on the power and the length of saturation sequence, we define the LIFT excitation flash as
QA flash or PQ flash. In the saturation portion of QA flash (SQA)
the excitation power is selected at a level sufficient
to reduce QA to more than 90% level while minimizing electron flow to PQ Pool. In the saturation portion of PQ flash (SPQ) the excitation power is ~ 10 times lower,
but applied over ~100 times longer period to reduce PQ Pool.
This sequence of QA-PQ flashes can be generated with the following four lines of excitation protocol:
flash 300, len 1.6, del 2.5, inc 1.0
flash 127, len 1.6, del 30, inc 1.03
flash 6000, len 1.6, del 20, inc 1.0
flash 300, len 1.6, del 2.5, inc 1.03
Arbitrary sequences of flashes can be programmed by just repeating protocol directives
in the excitation protocol editor. Applying such flash sequence to a 60-seconds dark adapted lemon tree leaf (upper transient) generally results in the first flash displaying
~25% higher Fmax than the subsequent flashes. The same protocol applied in presence of 5 μmol quanta m-2s-1 IR
light produces fluorescence transients with roughly similar Fmax. This observation suggests possible control of PQ pool reduction level on the fluorescence yield.
A QA-PQ-QA flash sequence can be programmed by extending the length of saturation
sequence in second flash to ~7,000 flashlets at time interval of 25 μs. Observe about 2-times increase in the fluorescence yield at completion of the PQ flash, and about
30% higher fluorescence yield in the second QA flash.
NOTE: Examples of LIFT/FRR protocols presented here are to demonstrate the flexibility of the instrument excitation protocols.
Although they may serve as a templates (the instrument software is pre-loaded with these templates), actual applications may require modifying these protocols to satisfy user requirements.
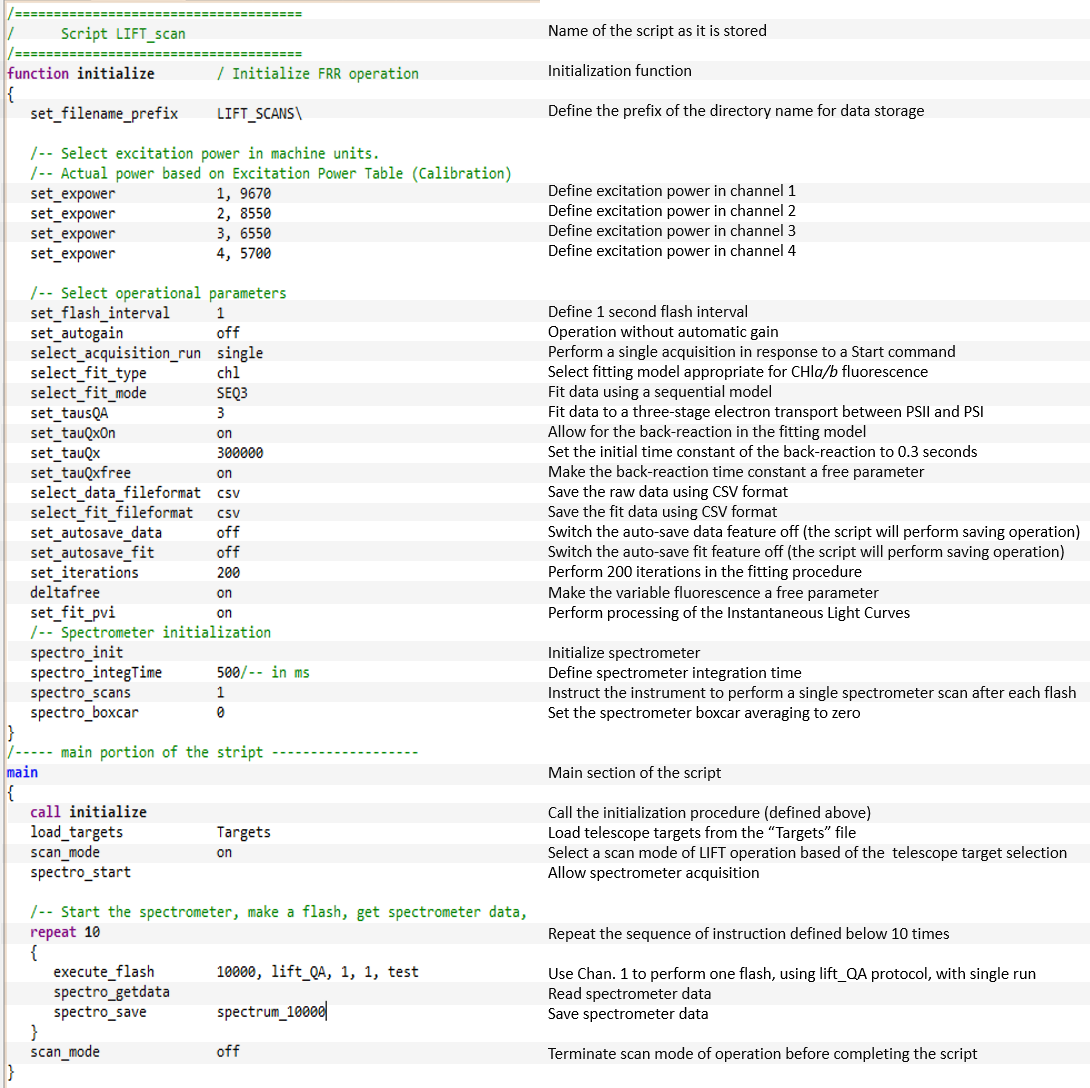
Instrument control can be performed entirely from the user interface panel. The automated mode of operation, however, is best managed by the LIFT/FRR Execution Scripts (LES).
These scripts define the instrument initialization procedure, selection of the excitation channels and excitation power, sequence of control commands,
and data management. Scripts can be designed to perform various experiments, including single acquisition, a timed sequence of acquisitions,
or continuous/indefinite loops of instrument operations. All instrument functionality, including acquisition of fluorescence transients,
data processing, spectrometer operation, and telescope operation can be programmed using execution scripts. An example of the LIFT script presented above is used to perform a series of measurements
on an array of targets whose coordinates are stored in the "Targets" file. The script presented here displays just a subset of the LIFT commands.
The entire command list will be presented in the LIFT Manual pages.
LIFT scripts can call other scripts, allowing a hierarchical structure of instrument control, up to five levels deep.
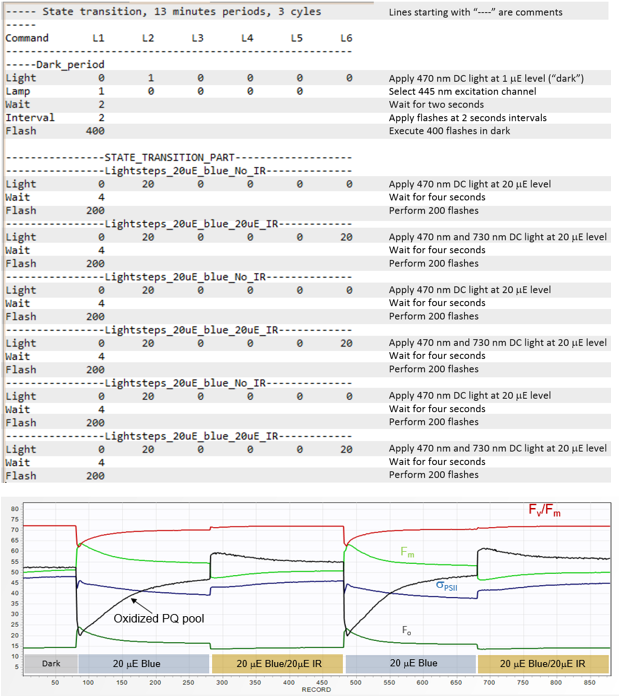
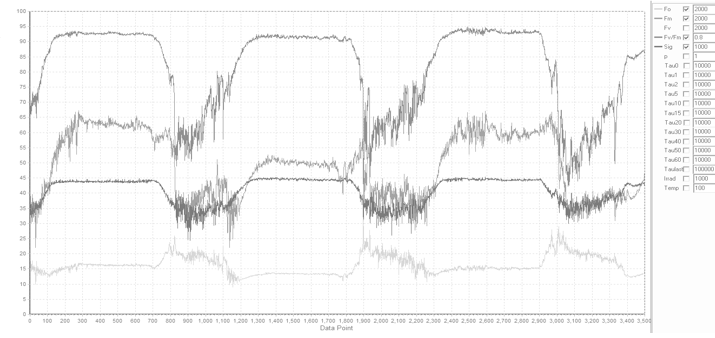
LIFT Kinetics scrips (LKS) are used to control DC illumination regime in a range of experiments that require synchronization between
light control and acquisition of fluorescence transients. These experiments include RLC (Rapid Light Curves) acquisitions,
assessing the extent and the dynamics on nonphotochemical quenching, and State Transition experiments. The example kinetics script shown here was used to perform State Transition experiments on Parsley leaves,
with the results presented below. The initial "dark adaptation" period was performed in presence of 1 μmol quanta m-2s-1 of blue (445nm) nm light
to avoid excessive reduction of PQ Pool prior the measurements (the merits and perils of long-term dark adaptation will be discussed later).
Note the sudden reduction of PQ pool following application of 20 μmol quanta m-2s-1 of blue light, accompanied by about 20% increase in the Fs and
Fm level, followed by a gradual decrease in these signals, in sync with the decrease in functional absorption cross section. These trends are reversed upon addition
of 20 μmol quanta m-2s-1 of the IR (730 nm) light.
The kinetics scripts can be initiated from the control panel of the LIFT/FRR software, or can be called from the LIFT/FRR execution scripts described in the previous section.
The latter mode of operation is more preferable since LES can initialize the instrument, thus preserving the consistency of experimental conditions.
Also, LES have the ability to pre-program the spectrometer operation, allowing acquisition of the reflectance spectra during light manipulation experiments.
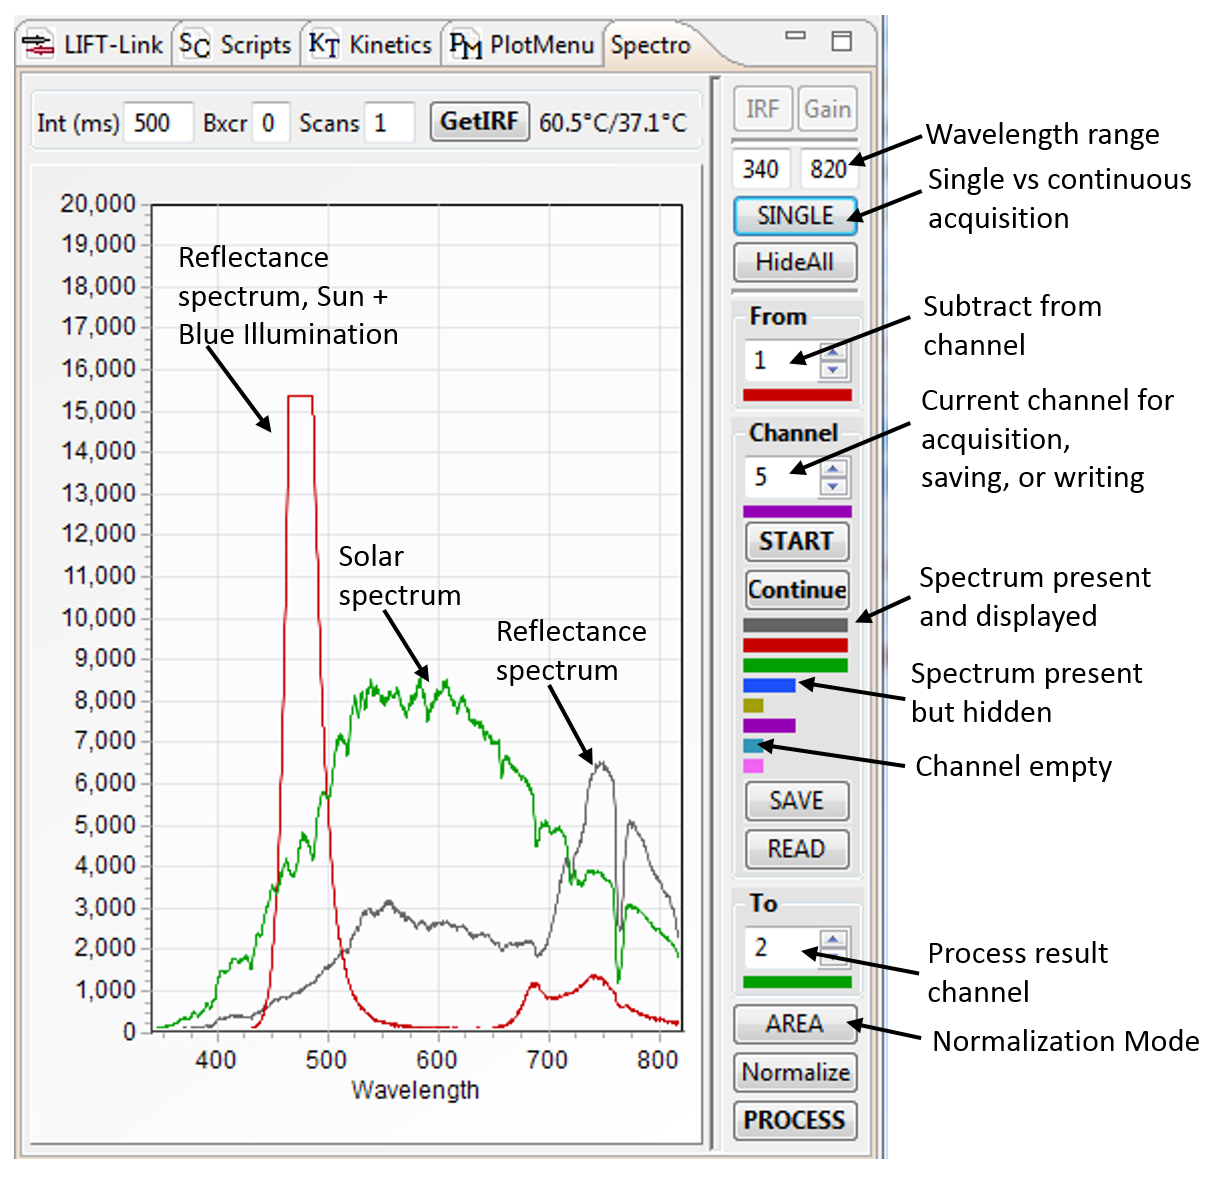
LIFT in-line spectrometer acquires reflectance spectra from the LIFT target.
Spectrometer acquisition can be synchronized
with LIFT operation to acquire reflectance spectra during or after LIFT flash, during application of the LIFT DC illumination signal, or can be triggered by transient changes
in solar irradiance. The spectra shown in the right were acquired in presence of ~ 100 μmol quanta m-2s-1 solar illumination (black trace). Under these condition,
the fluorescence emission, contributing to less than 2% of the Sun-reflected light, remains buried in the reflectance signal. Projecting ~800 μmol quanta m-2s-1 of
LIFT-generated blue light onto the target exposes the fluorescence emission (red trace, scaled down ~ 20 times). The presence of the oxygen absorption line in the red trace is still discernible as this signal represents
a superposition of the blue-light induced fluorescence, solar-induced fluorescence, and the direct solar reflectance signal.
The fluorescence signal can also be extracted from the reflectance spectra by recording
transient responses to bright sunflecks . As the solar exposure changed abruptly from low (less that 10
μmol quanta m-2s-1) to high (~800 μmol quanta m-2s-1), there is a significant change in the reflectance signal in 660 nm to 780 nm spectral range within the first second
of the exposure. The difference spectra between the 1-second and 60-seconds responses
are strikingly similar to the difference spectra between the "blue-light assisted" and the background reflectance spectra (see the figure inset). The blue-light-assisted (BLA) technique can therefore be used to validate
the "sunfleck-based" approach for reconstruction of the target fluorescence spectra.
To summarize, there are at least two approaches toward quantifying the solar induced fluorescence with LIFT: one using BLA technique, the second using the transient changes in the
reflectance spectra induced by solar sunflecks. Systematic observations of these two signals should reveal a relationship between the solar-stimulated
fluorescence, the actively induced fluorescence, and the photosynthetic characteristics of plants. These capabilities may advance the objectives of the European FLEX Mission program.
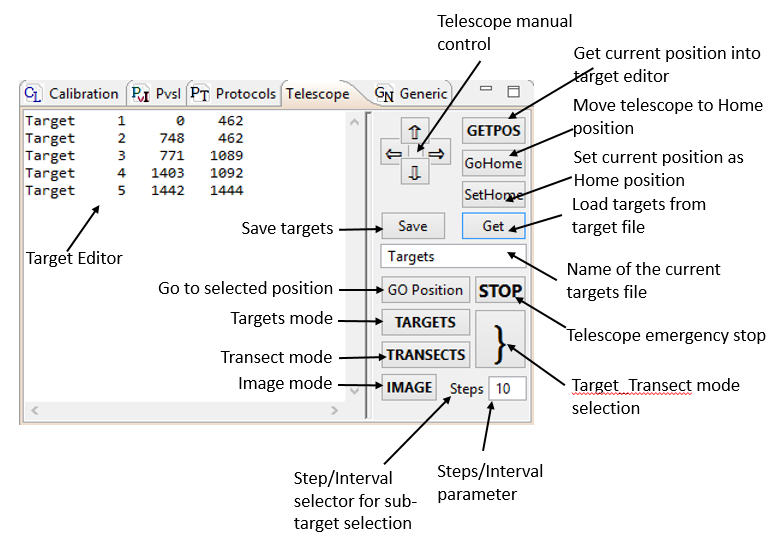
The telescope control panel allows programming a sequence of targets and defines the mode of accessing these targets:
- Sequential mode: target-by-target selection.
- Transect mode: performing measurements while transecting between targets. The density of sub-targets is defined either by the angular distance, or by the number of pre-set data points between successive targets.
- Imaging mode: scanning between pairs of targets, usually arranged in horizontal or vertical lines pattern, to produce a rectangular image of the object.

LIFT Development History
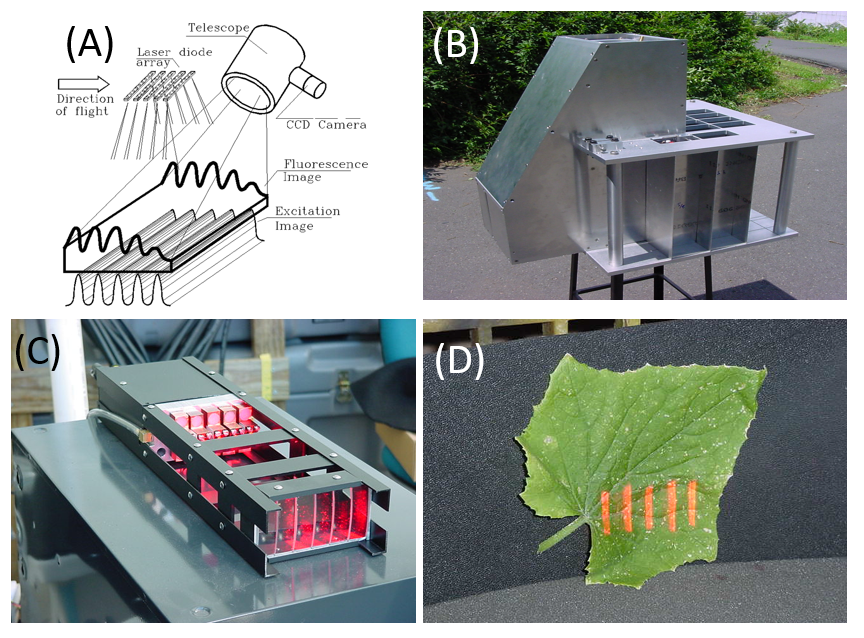
A concept of an airborne LIFT instrument was developed at Rutgers University in 1998 (A). An image of up to 60 stripes is projected over 1 meter x 1 meter area from a mowing airborne platform (B) using an array of laser diodes (C). Flying at speed of about 215 km/hour (cruising speed of Twin Otter airplane), this image creates a periodic excitation signal on the ground (D) over a period of 16 ms. Forty of these stripes are arranged within the first 2 ms of the excitation image, the remaining twenty are spaced along the next 14 ms to produce saturation/relaxation excitation sequence. A red-sensitive camera equipped with 250 mm telescope system and a synchronous shutter acquires a "static" image of the produced fluorescence pattern. When flying above a homogenous target, the static fluorescence image can be integrated by the CCD camera over a period of several hundred ms to build up the S/N ratio. The prototype LIFT system (A) was built and was equipped with 12 excitation modules, each containing 5 individually-adjustable laser diodes (B and C). The system was ground-tested at a distance of up to 196 meters (E). The laser excitation source was designed to operate in the DC mode for 60m/s moving airborne platform, and in the pulsed mode for a static (helicopter-based) airborne platform. A mounting plate for NASA Twin Otter plane was designed, and preliminary cleared by NASA engineers. Regretfully, the project was terminated before flight tests. The development effort was led by Zbigniew Kolber, currently at Soliense Inc. The mechanical, optical, and most of the electrical design of the airborne LIFT instrument was done by Denis Klimov, currently an engineer at Monterey Bay Aquarium Research Institute.
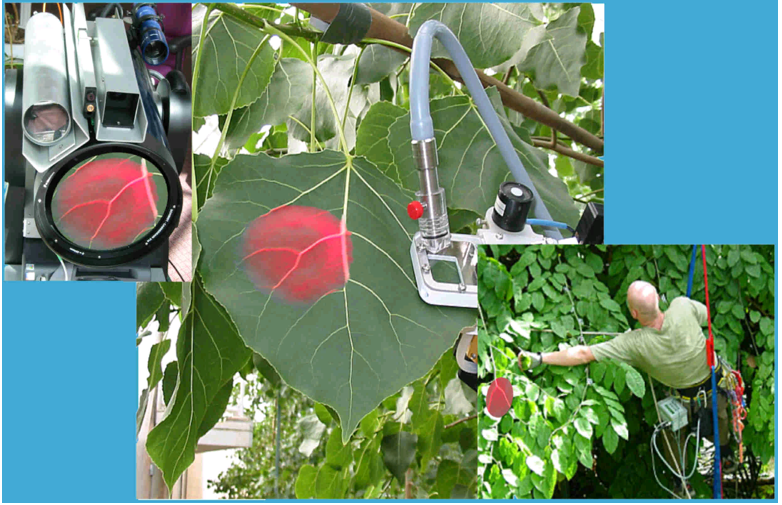
Biosphere II installation served as a first "field" test deployment of the LIFT instrument, starting in 2002.
Under short, but very successful leadership of prof. Barry Osmond, Biosphere II Center, Arizona, was briefly transformed into a world-class research laboratory where early hypotheses regarding
effects of ocean acidification on coral physiology, and effects of elevated atmospheric CO2 concentration on plant physiology were tested under well-controlled conditions.
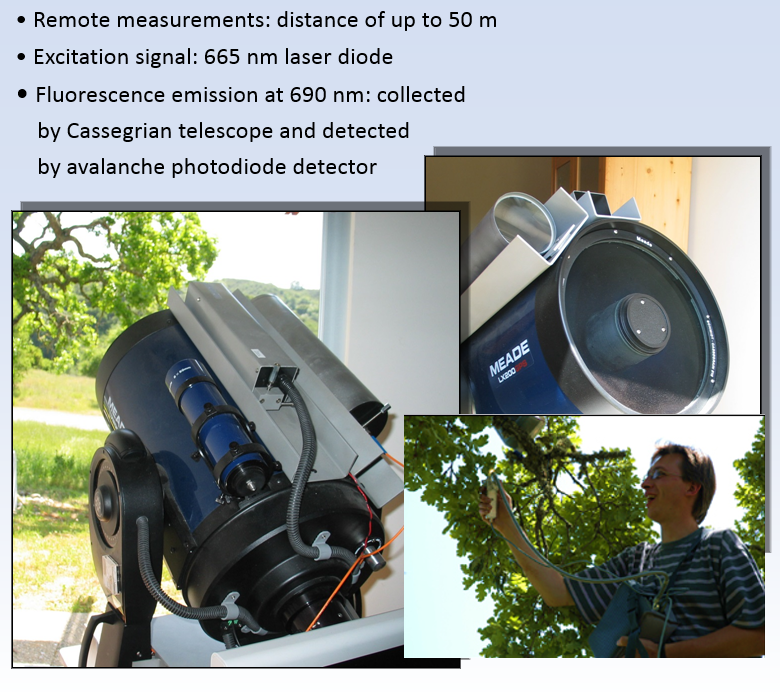
The laser-equipped LIFT instrument, operating at a distance of up to 50 meters, was well suited
for the latter applications as the instrument could operate through the glass windows of closed biomes with controlled CO2 concentrations. The motorized telescope stand allowed continuous scanning
of an array of targets, and network-enabled control allowed continuous access to the instrument from the East Coast.
Comparison between remotely acquired LIFT data and on-leaf acquired PAM data basically verified LIFT operation, although there were some questions regarding differences in the experimental approach.
Operating at a distance of about 20 meters on array of small Arabidopsis plants
the high temporal resolution of LIFT measurements allowed
identifying patterns of NPQ quenching on the wild-type, type 5 mutant, and NPQ-4 mutant.
Not only the kinetics of NPQ development differed between these plant, but the patterns of the initial rise of the Fm> fluorescence signal within first 5-10 seconds after light exposure
was dramatically different (see the details indicated by the blue circle). This unusual behavior, however, didn't conform with the existing notions regarding the
nonphotochemical quenching (see the enclosed reviewer comment).
More detailed experiments, using stronger, 2000 μmol quanta m-2s-1,
1 second long pulse of white light caused about 80% increase in the Fm signal. Within 5 seconds after removing white light the Fv/Fm signal returns to the pre-illumination level,
indicating dissipation of the photochemical quenching, while the Fm signal still exceeded the pre-illumination level by about 30%.
The development of transient "negative" NPQ following exposure to a strong white light requires revising the existing perception regarding the mechanisms and definitions of NPQ.
Based on LIFT measurements performed through glass window of CO2 controlled cottonwood biomes,
the photosynthetic yield in units of carbon fixed per photosynthetic electrons
was shown to be about 2 times higher in the 1220 ppm CO2 biome compared to 380 ppm CO2 biome.
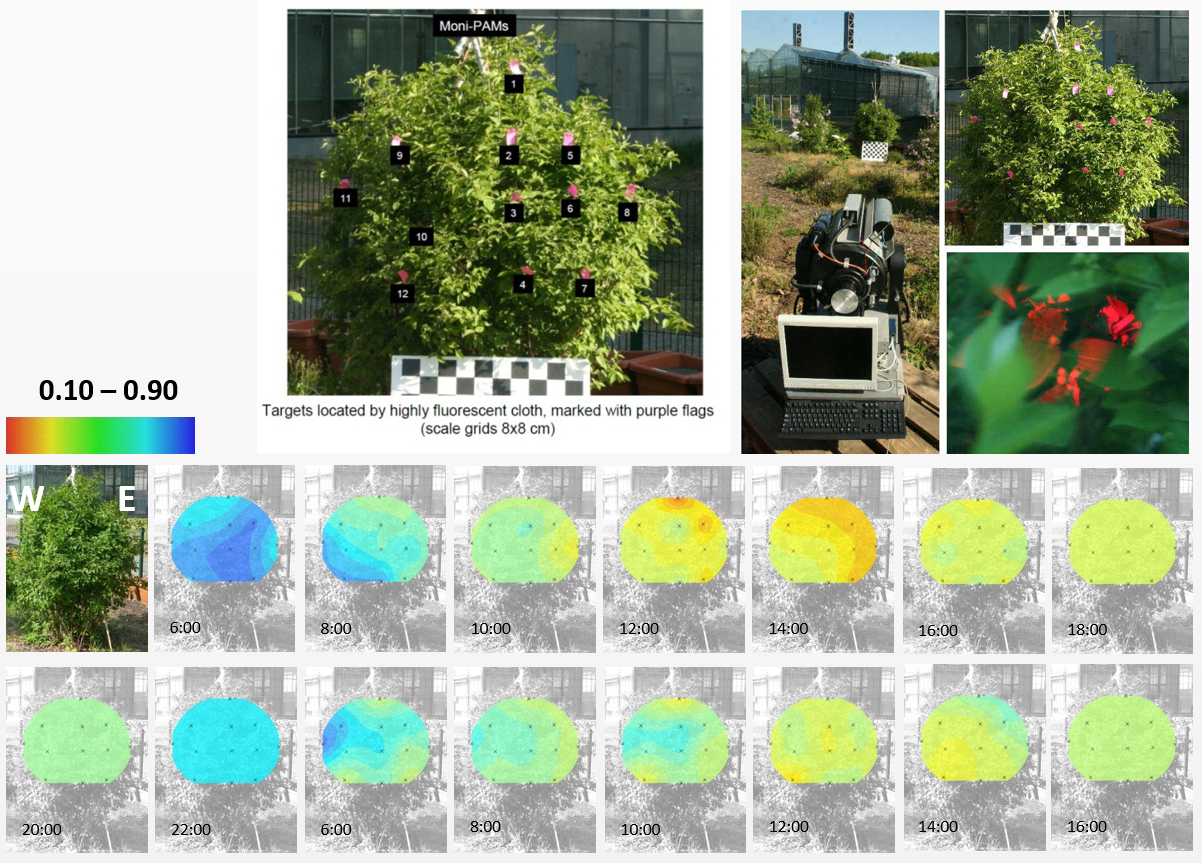
In 2005 the prototype LIFT instrument was transferred from Biosphere II Center to Carnegie Institute at Stanford, and was operated for the next three years by Dr. Roland Pieruschka, now with Jülich Forshungszentrum, in several experiments including hydration/dehydration studies of mosses. In 2006 the instrument was used to study combined effects of temperature/irradiance stress on crop plants, operating autonomously from the balcony of the Carnegie building at Stanford, scheduled to perform measurements at predawn hours (to avoid the confounding effects of ambient illumination) over a period of five weeks. Example data acquired on Lycopersicon esculentum demonstrated the effect of the significant temperature drop on Nov. 21, 2006, resulting in about 35% decrease in Fvv/Fm. PAM measurements (a little bit less convenient at such early hours) revealed similar pattern. More detailed LIFT data acquired during "cold" spell at Stanford on Persea americana revealed heterogeneous response to the cold stress between the upper and the lower portion of the plant canopy. The upper portion, subjected to higher average irradiance level, displayed quite severe depression in Fvv/Fm, while the lower portion, with less light exposure, showed no response to temperature stress. The fluorescence picture of the plant canopy of a young Avocado tree was acquired by scanning the plant using an array of the LIFT targets, followed by a series of PAM measurements. The heterogeneity of Fv/Fm distribution, decreasing toward the top of the canopy, was clearly observed in the LIFT-derived image, but was absent in the PAM-derived image.
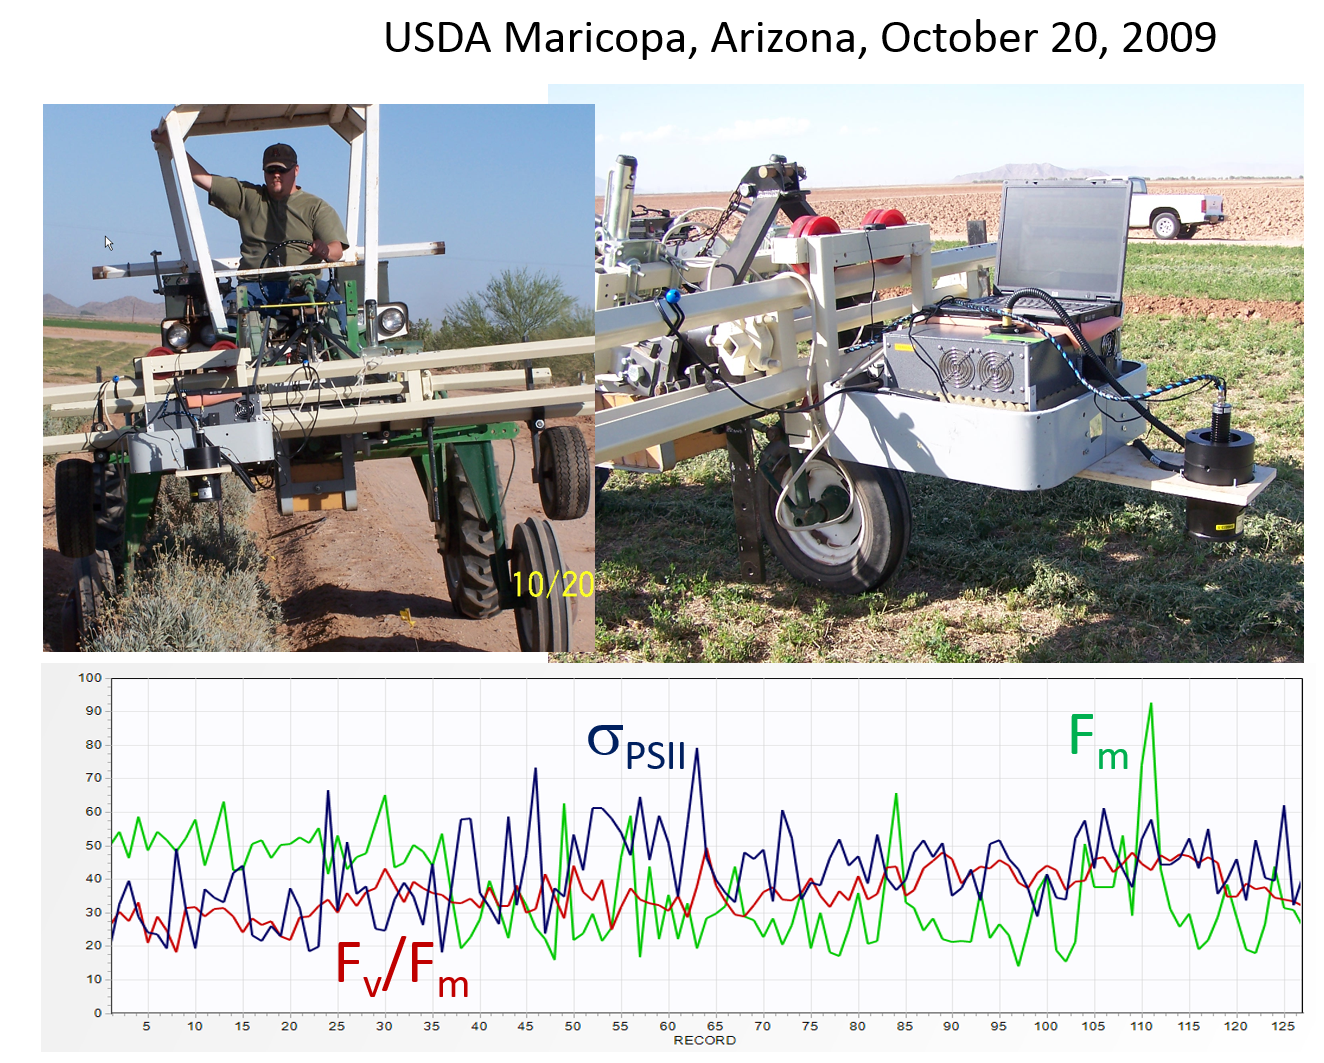
The first attempt to operate a prototype LIFT instrument on a tractor frame was arranged by Dr. Michael Salvucci in October 2009 at USDA Arid Land Agricultural Research Center, Maricopa, Arizona. The experimental setup employed a standard FRR fluorometer, originally designed for marine applications, equipped with an external flasher circuitry based on a single, 455 nm LED light source. The fluorescence signal was collected by 100 mm, home-built telescope, and transferred, using optical light guide, into a sample chamber of the fluorometer. The instrument operated at ~50 cm height above the target. Due to sparse vegetation, only records with Signal-to-Noise ratio (S/N) higher that 10 were processed and displayed. Despite relatively noisy data, a trend of increasing Fv/Fm and the functional absorption cross section could be detected along some of the tractor tracks.
In 2010 the instrument was transferred (together with Roland) from Carnegie to Jülich Forshungszentrum, where it was used to perform a series of experiments in the grounds of Plant Sciences Dept., IBG-2. For a better view, LIFT instrument was "lifted" onto the roof of the Plant Sciences building. A year later, the instrument was lifted even higher, to the top of a tower constructed on the grounds of Campus Klein-Altendorf , a Biological Station of Bonn University. This operation provided first "engineering" experience regarding a long-term deployment under highly-variable environmental conditions. Two weak points were quickly identified
- Instrument detector, based on a Large Area Avalanche Photodiode (LAPD), was highly sensitive to excessive light levels, failing under condition of high irradiance levels frequently experienced under full sun(1) .
- Limited sensitivity due to highly-restrictive eye-safety regulations, requiring operation with relatively low laser power(2) .
With that, development effort on a commercial version of LIFT instrument has been initiated.
(1,2)Based on that experience, a search for new detectors and new excitation light sources have begun.
This effort, with an objective of improving instrument sensitivity
and operational distance while satisfying the eye-safety requirements, still continues...
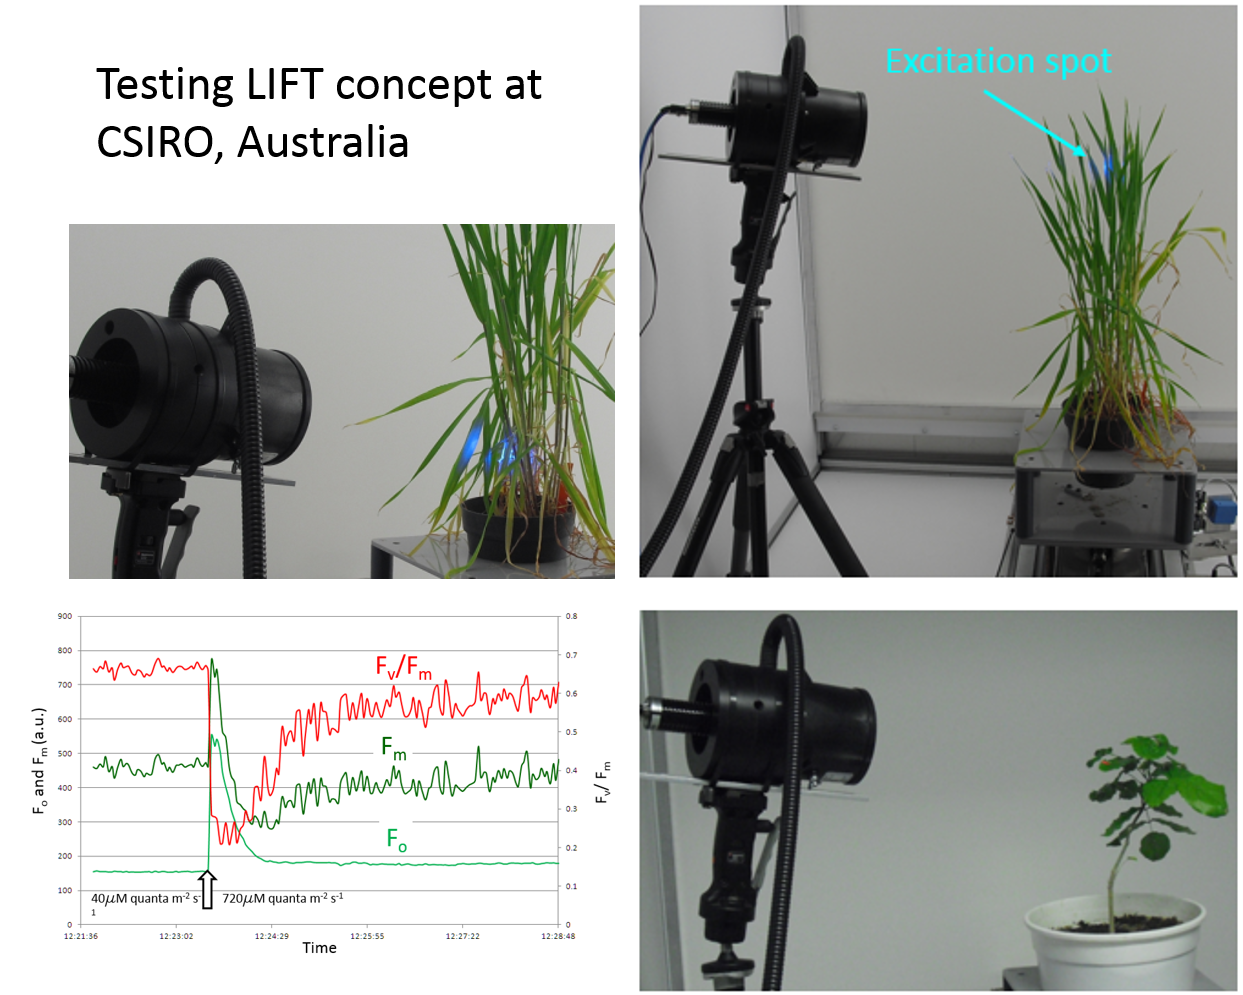
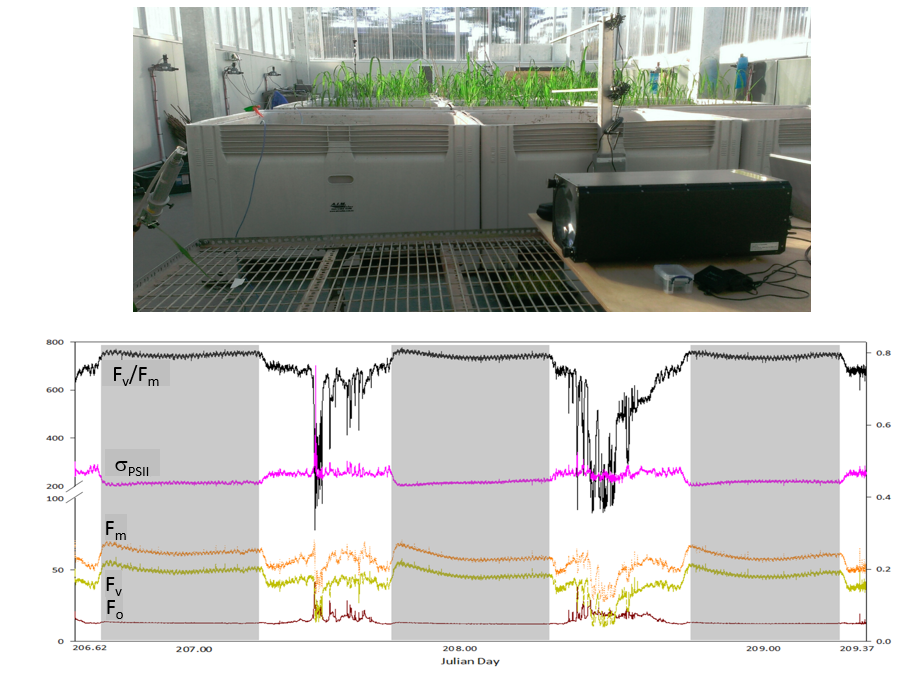
Experimental version of the LIFT instrument was tested in
CSIRO scanning chamber in July 2010 at initiative of Prof. Barry Osmond and Dr Robert Furbank.
In one of the experiments, a
wheat plant was scanned at 360o angle, at nine height levels.
The scan revealed a heterogeneous distribution of photosynthetic parameters along the height of the plant canopy, with maximum of Fv/Fm at the top
(morphologically the "healthier"-looking part of the plant), decreasing to the bottom, with visible indication of senescence.
The functional absorption cross section displayed a reverse pattern, with minimum at the top, indicative of acclimation to higher irradiance levels there.
Calculated properties of P vs I relationship basically followed the same pattern:
high initial slope of the P vs I relationship at the bottom of the plant, consistent with optimizing photosynthetic performance under low irradiance regime, and high Ek at the top,
consistent with high performance under high irradiance regime.
Intuitively, such vertical distribution of photosynthetic characteristics is not surprising. The question is whether such distribution of photosynthetic properties was "acquired" due to exposure to varying
light regime during plant growth, or if the plant is "programmed" to display this patterns, with the light regime playing a secondary effect.
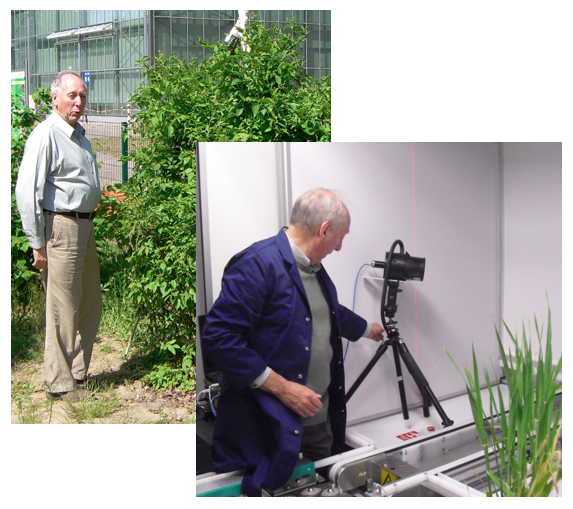
We would like to acknowledge the support, enthusiasm, and encouragement of prof. Barry Osmond in lifting the LIFT concept off the ground.
It was Barry who convinced us, sea-going oceanographers, that there is photosynthesis on dry land, and it may be of some importance.
He was the first among plant physiologists who realized that our technique, known as Fast Repetition Rate Fluorescence (FRRF),
originally developed to study photosynthesis in marine environment, would offer new insight into photo-physiology of higher plants.
He passionately embraced the LIFT ability to measure the functional and optical absorption cross section of PSII, the kinetics of electron transport, and the size of PQ pool.
A renowned researcher in the field of photoprotection and nonphotochemical quenching, Barry understood how much was there to learn with the new technique.
Young at heart, he continues to inspire students to break through dogmas of existing knowledge (and ignorance), and take risks with new ideas.
Barry enthused us to transform LIFT technique from an experimental tool into a commercial-grade scientific instrument and make it available to the scientific community.
There is a strong argument for the LIFT technique to be employed in search for more productive crop varieties under dramatically-changing environmental conditions.
We owe it to Barry to make it happen. In this effort, we would also like to acknowledge the support of the
Jülich Forshungszentrum team led by Dr. Roland Pierushka and Dr. Uwe Rascher, and the support of Dr. Robert Furbank and Dr. Xavier Sirault from CSIRO, Australia.
LIFT Applications
Commercial LIFT instrument was installed in CSIRO in July 2013.
Three days of initial tests with continuous measurements on a young rice plant in the temperature-controlled greenhouse revealed a small-amplitude
periodic oscillations in all the measured parameters, oscillations were synchronous with
~2oC oscillation in the greenhouse temperature.
These oscillations may have affected the excitation power of the LIFT instrument or the operation of the LIFT detector.
However, measurements performed with a luminescence standard displayed no temperature-related oscillations in the LIFT-measured signals,
indicating the biophysical nature of the observed oscillations. The amplitude of these oscillations, about 0.01 units of Fv/Fm,
demonstrated that small variations in photosynthetic properties, induced by variations in the ambient temperature, can be reliably resolved.
The relationship between the LIFT-measured Fv/Fm
and the PAM-measured Fv/Fm displayed R2 of 0.69, less than observed with Biosphere II tests (R2 = 0.81). The reason may have been that the small,
narrow leaf of the rice plant made it difficult to collocate the PAM and LIFT measurements on exactly the same target.
Using the reflected background signal at 685 nm as a surrogate for the ambient irradiance at the LIFT target, the LIFT-derived ETR values
displayed much higher correlation with corresponding PAM ETR values, at R2 levels of 0.97.
One problem identified in CSIRO LIFT installation was water vapor condensation on internal surface of the front, and on the secondary lens of the instrument. High heat capacity of these
lenses may have led to a situation where their temperature was falling below the dew point of the air. The first version of the LIFT instrument is cooled by fan-drawn air exchange,
and these conditions are likely to be present in the morning hours, when lenses are colder that the humid air drawn into the instrument.
To fix this problem, a new cooling scheme utilizing Peltier heat exchanger with hermetically closed instrument housing is
implemented in the redesigned version of the instrument.
Several LIFT instruments are currently being operated by the
personnel of Jülich Forshungszentrum IBG2. The instruments work in the open laboratory environment and in the
light/temperature-controlled environmental chambers, performing measurements on an array of targets.
Two instruments are installed in the
greenhouses of Campus Klein-Altendorf, an agricultural station of Bonn University, Germany.
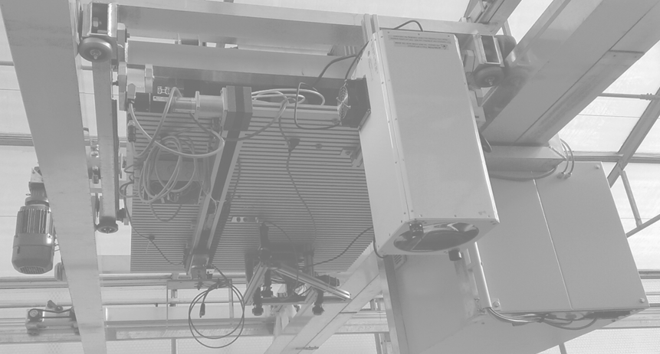
There the instrument operate from an overhang gantry,
continuously scanning small plots ("miniplots")
planted with a variety of cultivars. Portion of these plots are located
outside of the greenhouse, also accessible for continuous LIFT measurements.
A commercial LIFT instrument was delivered to the University of Wollongong in August of 2015.
Cross-comparison of the LIFT instrument against the pulse amplitude modulation (PAM) approach in avocado leaves showed that the LIFT instrument produced highly comparable
Fm or Fm’ and Fo or Fs values to those collected by PAM. The effect of leaf angle on LIFT measurements was exmined.
Although the raw fluorescence signal such as Fm or Fm’ were sensitive to leaf angle due to changes in both angular distribution of excitation signal and the reflected fluorescence signal,
the retrieved photosynthetic parameters such as Fv/Fm and σ PSII were relatively insensitive to leaf angle normal angle varying from -40o to 40o resepctive to FT excitation beam.
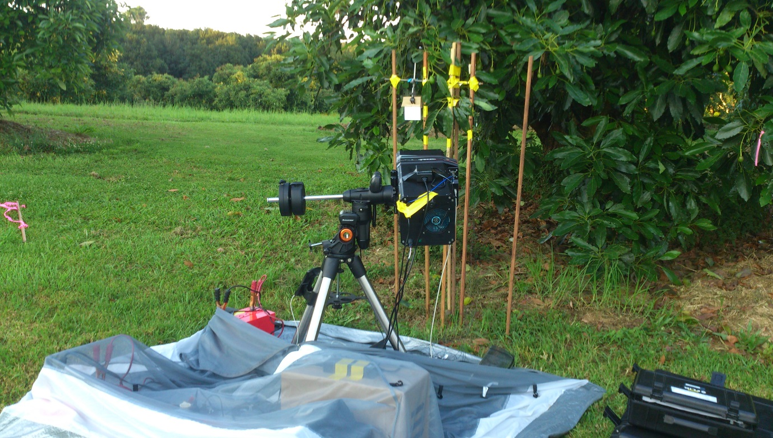
Following the initial assessment of the LIFT performance, the instrument was used in both laboratory and field settings to monitor photosynthesis (LIFT ifluorescence) and spectrally resolved leaf reflectance (LIFT spectrometer)
with high temporal resolutions during diurnal cycles. The software provided with the LIFT instrument allowed synchronizing data collection from the LIFT instrument, spectrometer data acquisition, and light sensors measurements
with operation of the motorized tripod, allowing continuous measurements of photosynthetic properties from and array of targets in the field.
The amplitude of the signal detected by the LIFT instrument decreases with the square of the distance to the target.
Also, the efficiency of beam projection at distances above 2 meters deteriorates in the LED-based instrument.
Therefore, the instrument sensitivity is defined, to a first degree, by the target distance. In case of sparse vegetation (i.e. narrow blades
of sparsely planted cereal plants) the return fluorescence signal is further affected by the aerial fraction of the target illuminated by the excitation beam.
Finally, varying leaf orientation with respect to the optical axis of the instrument will furthermore affect the amplitude and the Signal-to-Noise ratio (S/N)
in the recorded the recorded signal.
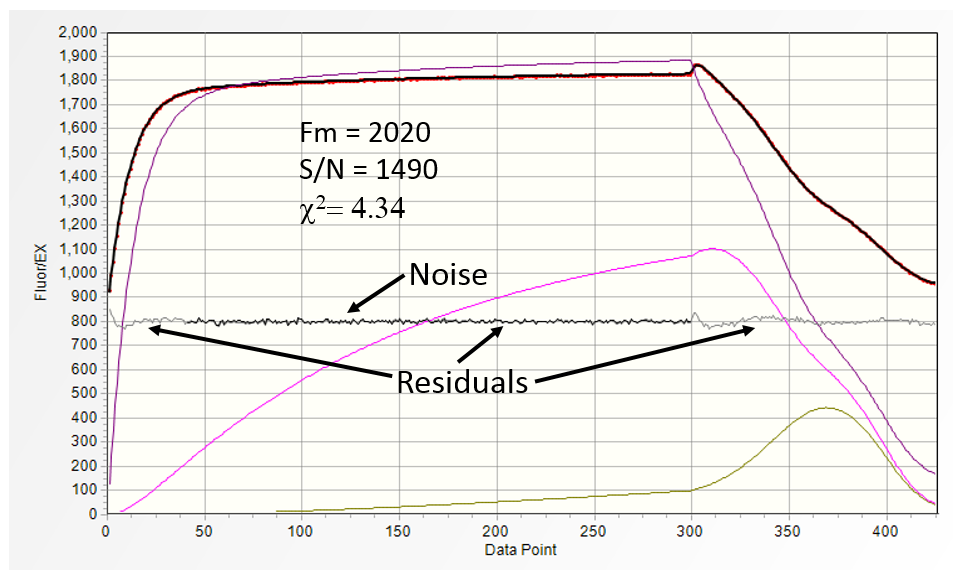
LIFT software calculates the S/N ratio in the raw fluorescence
data in real time, providing some information about the statistical quality of the measured photosynthetic properties.
The fluorescence transient above was acquired on the leaf of young lemon tree at a distance of 80 cm with exceptionally low noise (the black trace, amplified by a factor of 5) and high S/N of ~1490.
The visible oscillations in the residuals (grey trace) at the beginning and the end of the saturation portion of the fluorescence transients, and χ2 = 4.34
indicate that under such high S/N ratio the model, rather than the noise defines, the quality of the fit.
Distribution of residuals in the mid-portion of the transient is practically identical to noise distribution.
At 2.0 meters distance the
S/N decreased to 570, even though the instrument gain was increased by a factor of five.
The systematic deviations in the residuals are no longer discernible, and the χ2 = 1.24 indicates that the noise becomes a limiting factor of fit quality.
Increasing the distance to 3.0 meters results in a
further S/N decrease to 142, with χ2 = 0.96. At this noise level
the current model used to fit the data is likely to operate with too many degrees of freedom. As a result, some of the photosynthetic parameters may display large swings
in their values with little change in χ2. This effect becomes more pronounced at 4 meter distance to the target,
with S/N ratio dropping to 42), and χ2 hovering in 0.95-1.05 range. Note the much slower rate of
fluorescence transient saturation, indicative of less efficient projection of the excitation beam at this distance (a laser-equipped system would show about 50% decrease in the S/N ratio compared to 3 meters distance).
The effect of decreasing S/N ratio on the statistical quality of recovered parameters
can be analyzed by acquiring a series of measurements and observing the statistical quality of calculated parameters.
At 4 meters distance, with S/N ratio of 42 the statistical quality of the recovered parameters
(particularly the time constants of electron transport) becomes marginal. This quality can be improved by decreasing the number of free parameters in the model,
or by increasing the S/N by data averaging.
Averaging 10 transients when operating at 4 meter distance increases the S/N value to 137, resulting in data quality similar to that from 3 meters distance.
This approach is possible when operating on a stable target from a static platform, but at a cost of longer data acquisition.
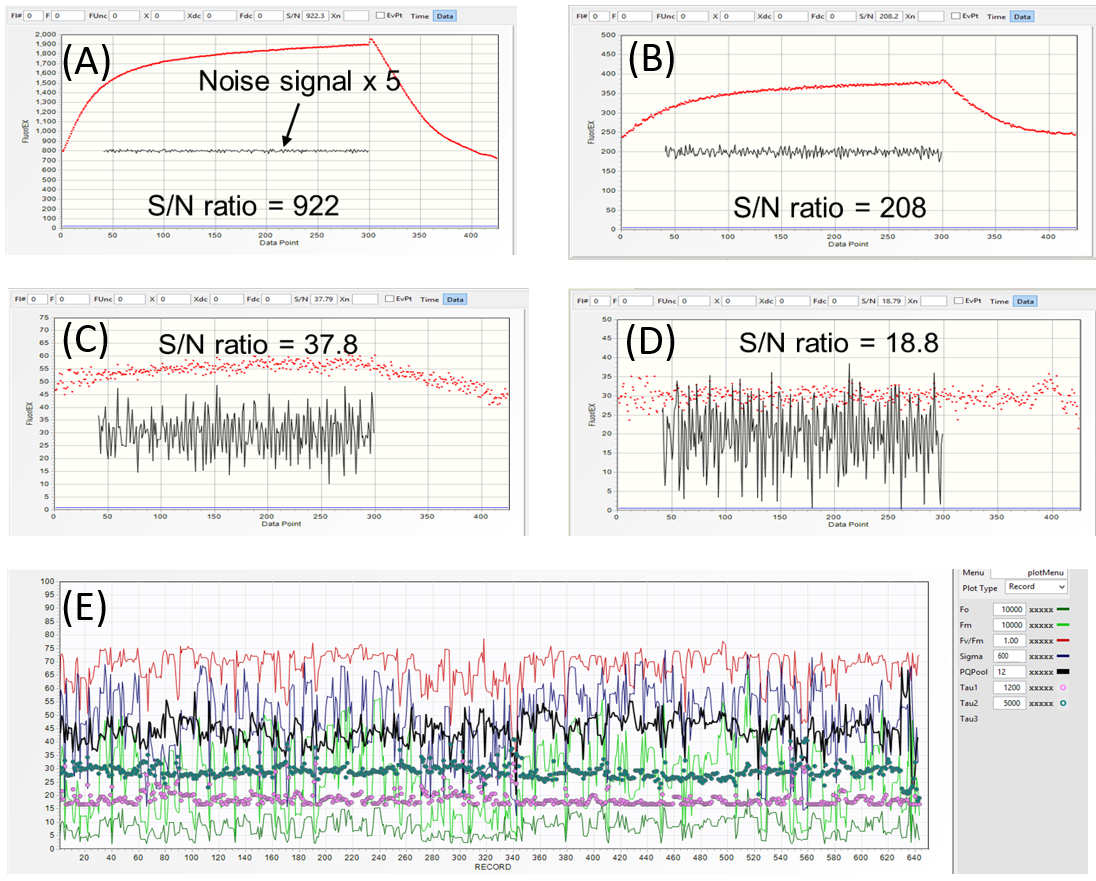
S/N ratio can also be used to discriminate between "On-target" and "Off-target" conditions when operating in a continuous
gantry mode over sparse vegetation. With ~1.4 meter distance, the fully "On-target", excitation beam produces a transient with
the S/N ratio of ~900 (A). As the excitation beam slides off the target, the three consecutive LIFT acquisition at 1 seconds intervals produce transient with S/N of 208 (B),
37 (C), and 19 (D). Because such "Off-target" acquisitions are inevitable during continuous operation, a threshold S/N level of 100-200 can be used to reject
such acquisition from the final analysis.
Results of a scan over soybean miniplots with the cut-off S/N ration of 100 is shown in (E). Even at this rejection threshold, the relatively high level of
variability in the Fm and Fs signals (light-green an dark-green traces) indicates changes in the vegetation coverage under illumination spot, target-to-target difference in the incidence
angle between excitation beam and leaf surface, or target-to-target changes in the local irradiance levels. The simultaneously acquired target images
using a pair of cameras triggered by LIFT flash should allow more detailed analysis of this variability.
Irrespectively, the level of variability in the acquired data, as shown in (E), is likely to be present in most of LIFT datasets. Therefore, acquisition of
large, statistically-significant datasets will be critical to identify systematic physiological/photosynthetic differences between cultivars.
Fast scanning and fast data acquisition (~1 transient/second), the ability to discriminate between the "On-target" and "Off-target" data,
and post-processing at several levels of S/N rejection levels should aid in this objective.
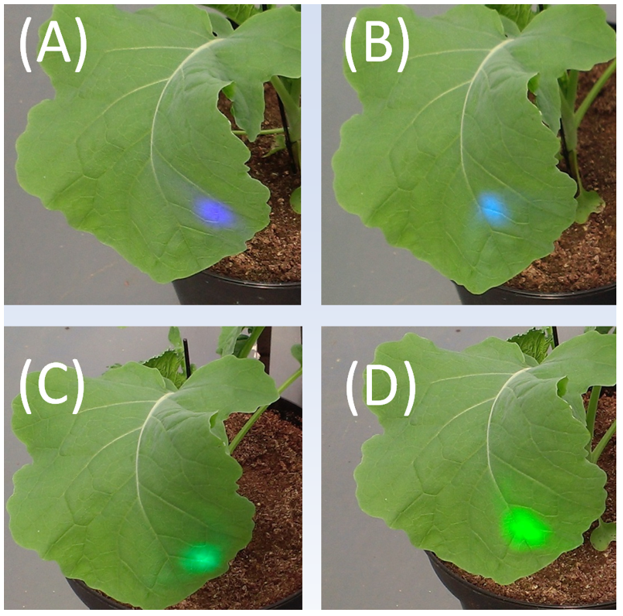
Lift instrument can be equipped with up to four-wavelength excitation source:
- 445 nm (A) to excite Chla
- 470 nm (B) to excite Chlb
- 510 nm (C) to excite lutein/zeaxanthin/β-carotene
- 435 nm (D) to excite lycopene
Any combination of these four wavelengths can be installed, and any combination of these four wavelengths can be activated to produce excitation flash of required spectral quality.
As the highest functional absorption cross is observed in 440-450 nm range, the 445 nm wavelengths is the most efficient in driving photosynthesis. Therefore, if extending the
target distance is the primary objective, the monochromatic, 445 nm excitation is most preferable.
Replacing LED-based excitation source with laser-based excitation source allows extending the range of LIFT measurements up to 50 meters.
The collimated nature of the excitation signal, however, severely restricts access to the experimental area due to eye-safety measures.
Dark adapt or not...
Measurements of the Fo signal requires short, 1- 5 seconds dark adaptation to reoxidize QA and remove the photochemical quenching. Assessment of non-photochemical quenching requires much longer,
>5 minutes, dark adaptation.
These procedures are impractical in normal LIFT operation during the day. On the other hand, prolonged dark adaptation produce additional,
quite complex effects, shifting photosynthetic machinery into a state much different from the normal operation under ambient light.
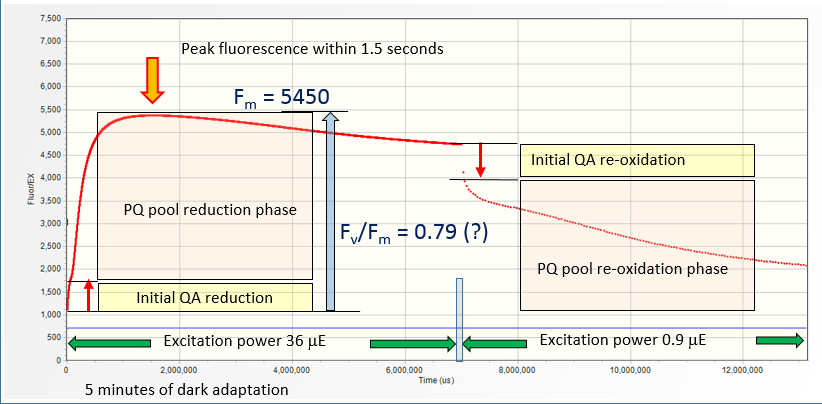
A five-minutes dark adapted lemon tree leaf subjected to a series of LIFT flashlets at 1.25 ms intervals
(the average excitation power of 36 μmol quanta m-2s-1) shows about ~500% increase in the fluorescence yield, from 1,100 a.u. to 5450 a.u. within 1.2 second. Taken at the face value,
this indicates Fv/Fm of about 0.79 achievable with relatively low excitation power of 36 μmol quanta m-2s-1.
Adding excitation signal of 18,000 μmol quanta m-2s-1
on the top of 36 μmol quanta m-2s-1 increases the fluorescence yield by another 350 a.u., fully reducing QA. We conclude that 36 μmol quanta m-2s-1 light applied
on a dark-adapted sample is capable of ~92% reduction of QA. This is only possible under conditions of a very slow electron transport from PQ pool to PSI.
The situation changes dramatically when the 5 minutes dark-adapted leaf is
exposed for 2 minutes to 36 μmol quanta m-2s-1 of white light, followed by short, 5 seconds of dark adaption.
The variable fluorescence produced by 36 μmol quanta m-2s-1 decreases by a factor of 10, with QA reduction level of about 19%.
The most likely explanation is about 4 times increase in rates of electron transport when exposing the long-term dark-adapted leaf to relatively low, 36 μmol quanta m-2s-1 irradiance levels.
The Fm = 2410 measured under these conditions is more than two times smaller than when measured with 5 minutes dark-adapted leaf (Fm = 5450). This indicates that not only the kinetics of electron transport
is affected by long-term dark adaptation, but also the intrinsic fluorescence yield changes as well. To answer this, a
sequence of 35 LIFT transients was produced, separated by 1 second intervals of low, ~0.9 μmol quanta m-2s-1
irradiance (flashlets applied at 50 ms intervals). During these intervals QA is expected to reoxidize, with the fluorescence yield decreasing to close to Fo.
Ambient illumination of 36 μmol quanta m-2s-1, applied for 2 seconds after the 5-th flash produced a peak fluorescence signal of 5400 units (similar to that observed before),
while the superimposed LIFT flash pushed fluorescence signal higher, to ~6000. After removing the ambient light, both the Fm and Fo signals decreased gradually to pre-illumination level, while the Fv/Fm
remained relatively constant at 0.60-0.61 level (except of the first post-illumination flash with Fv/Fm = 0.57, with ~5% QA still in the reduced state). This observation indicates that
both Fm and Fo signals increase in response to PQ pool reduction. Similar result was observed with the
sunflower plant.
This experiment, performed with cottonwood tree yielded somewhat different result, where the post-illumination Fv signal, not the
Fv/Fm remained constant while post-illumination Fm and Fo decreased, indicating that the basal Fo signal changed with the level of PQ pool reduction.
Spinach chloroplast results indicates that the slowdown of electron transport
in the dark and the increase in Fo and Fm following the subsequent PQ pool reduction are characteristic of operation of the photosynthetic apparatus, not the mesophyll architecture of the leaf.