Marine LIFT Instrument
LIFT-FRR Fluorometer
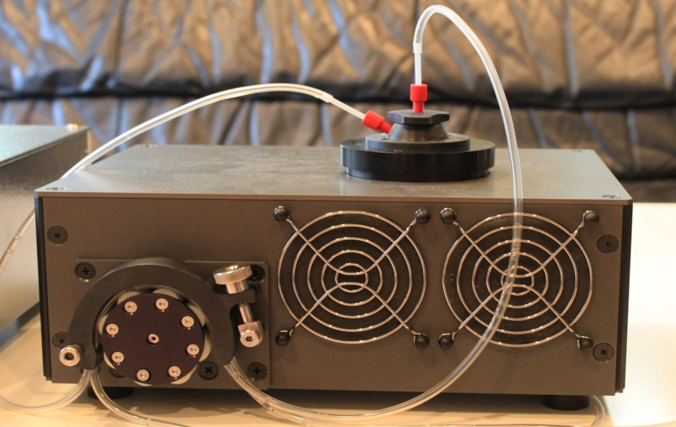
Soliense FRR fluorometer measures actively-induced variable fluorescence in aquatic environments. The instrument uses an array of software-controlled excitation light sources operating in pulse/DC mode to manipulate the state of photosynthetic reaction centers while measuring changes in the fluorescence signal emanating from Photosystem II chlorophyll antenna. The measured fluorescence transients are processed by FRR application software (included), allowing for the quantification of a wide range of biophysical characteristics that determine photosynthetic performance of marine and fresh-water algae and photosynthetic bacteria. Operating with five excitation wavelengths (445 nm, 470nm, 505 nm, 530 nm, and 590 nm) the instrument can discriminate between different phytoplankton groups based on spectral composition of their light harvesting pigments. Software-controlled, 6-position filter wheel allows further discrimination based on emission wavelengths. Optionally, the instrument can be equipped with 8 additional excitation channels operating in DC mode, with an oxygen sensor, a temperature controller, and a magnetically-coupled mixer. Integrated, software-controlled, stepper motor driven pump allows precise flow control when operating in a flow-through mode.

Specifications
Photosynthetic characteristics measured
- Functional and optical absorption cross section of
Photosystem II. - Yield of photosynthetic charge separation.
- Kinetics of photosynthetic electron transport.
- Probability of energy transfer between PSII reaction centers.
- Kinetics and amplitude of non-photochemical quenching of chlorophyll fluorescence.
- PQ pool size based on the kinetics of electron transport(1).
- PSII acceptor side carotenoid quenching(1).
- PSII donor side P680+ quenching(1).
- Parameters describing the relationship between Electron Transport Rates (ETR) and irradiance such as initial slope, saturation point, and maximum electron transport level:
- Using software-controlled light step protocols; requires 5 - 15 minutes measurement time
- Using the FRR Instantaneous Light Curves (ILCs)(1); requires ∼200 ms measurement time
- Photosynthetic responses to varying light levels (State transition, changes in PQ pool redox level).
(1) Properties measured exclusively by Soliense instruments
Sensitivity
- Chlorophyll concentration down to 0.01 μg/l with raw data Signal-to-Noise (S/N) ratio at single acquisition of ~5(2). At this Chla concentration 32 acquisitions are averaged, which is our standard recommended procedure when operating the instrument in open-ocean oligotrophic waters.
(2) This S/N ratio in raw data allows assessment of Fm at S/N ratio of ~19, and assessment of Fv/Fm with S/N of ~3. Robust analysis of other properties, such as functional absorption cross section and kinetics of photosynthetic electron transport at this chlorophyll concentration usually requires averaging of about 30 fluorescence transients, pushing the S/N ration to ~ 30 (see the discussion regarding S/N ratio later on this page).
Spectral Range and Excitation Power
- Any combination of five excitation wavelengths: 445 nm, 470 nm, 510 nm, 530 nm and 590 nm( (3)
- Excitation power in FRR mode:
- 445 and 470 nm: up to 32,000 μmol quanta m-2s-1
- 505nm: up to 24,000 μmol quanta m-2s-1
- 530nm: up to 18,000 μmol quanta m-2s-1
- 590nm: up to 12,000 μmol quanta m-2s-1
- Excitation power in DC mode:
- 445 and 470 nm: up to 1,600 μmol quanta m-2s-1
- 505nm and 530nm up to 1,200 μmol quanta m-2s-1
- 590nm: up to 600 μmol quanta m-2s-1
- 730nm: up to 40 μmol quanta m-2s-1
- Up to eight excitation channels for assessing presence of photosynthetic/non-photosynthetic pigments in water sample (optional)
- Fluorescence emission at 6 software-selectable emission wavelengths using a motorized, software controlled 6-position filter wheel (4).
(3) Selection of excitation wavelengths can be further customized to satisfy requirements for selective excitation of
different photosynthetic pigments and can be tailored to user specifications.
(4) The filter wheel is factory-preloaded with user-specified emission filters. Emission wavelengths may be tailored toward
particular phytoplankton groups based on the spectral properties of their fluorescence signal, or for assessing
presence of non-photosynthetic pigments in the water.
LIFT-FRR-1.0
- Size: 300 mm (width) x 120 mm (height) x 210 mm (depth).
- Power consumption: 20 W max (with all CW illumination light sources at maximum).
- Power supply: external 19 V AC-DC power supply operating at 105 - 220V, 50-60Hz (provided).
Base Unit (LIFT-FRR-1.0
- Six excitation wavelengths: five FRR/DC excitation sources and one infrared DC excitation at 730nm with software-controlled wavelength selection and excitation power.
- Six-position motorized filter wheel with software-controlled selection of emission wavelength.
- One flow-through cuvette assembly, one open cuvette assembly.
- Stepper-motor driven pump specifically designed for “leaky” operation, allowing continuous sample pumping through sample chamber without damage to phytoplankton cells. Pump control is integrated with FRR software, allowing Flow-On and Flow-Off functions to be synchronized with FRR measurements.
- External laptop computer for instrument control using high speed USB interface.
- FRR control software with unlimited, free software updates.
- External power supply.
- Shipping case (Pelican REPC1550NF).
Instrument Options
- FRR-EX-1.0
Five additional DC excitation channels, selected to user specification in range 280 nm - 450 nm. - FRR-M-1.0
Mixing sample chamber with software-controlled mixing rates. In normal mode of operation, mixing chamber allows operation of the oxygen sensor and the temperature controller. In “shear” mode, high mixing rates allow cleaning of the internal surfaces of the sample cuvette. - FRR-MO-1.0
Mixing sample chamber with integrated oxygen sensor. - FRR-MT-1.0
Mixing chamber with integrated temperature controller. - FRR_MX-1.0
Mixing chamber with three extra DC excitation channels.
NOTE: any combination of the last three options can implemented at user request
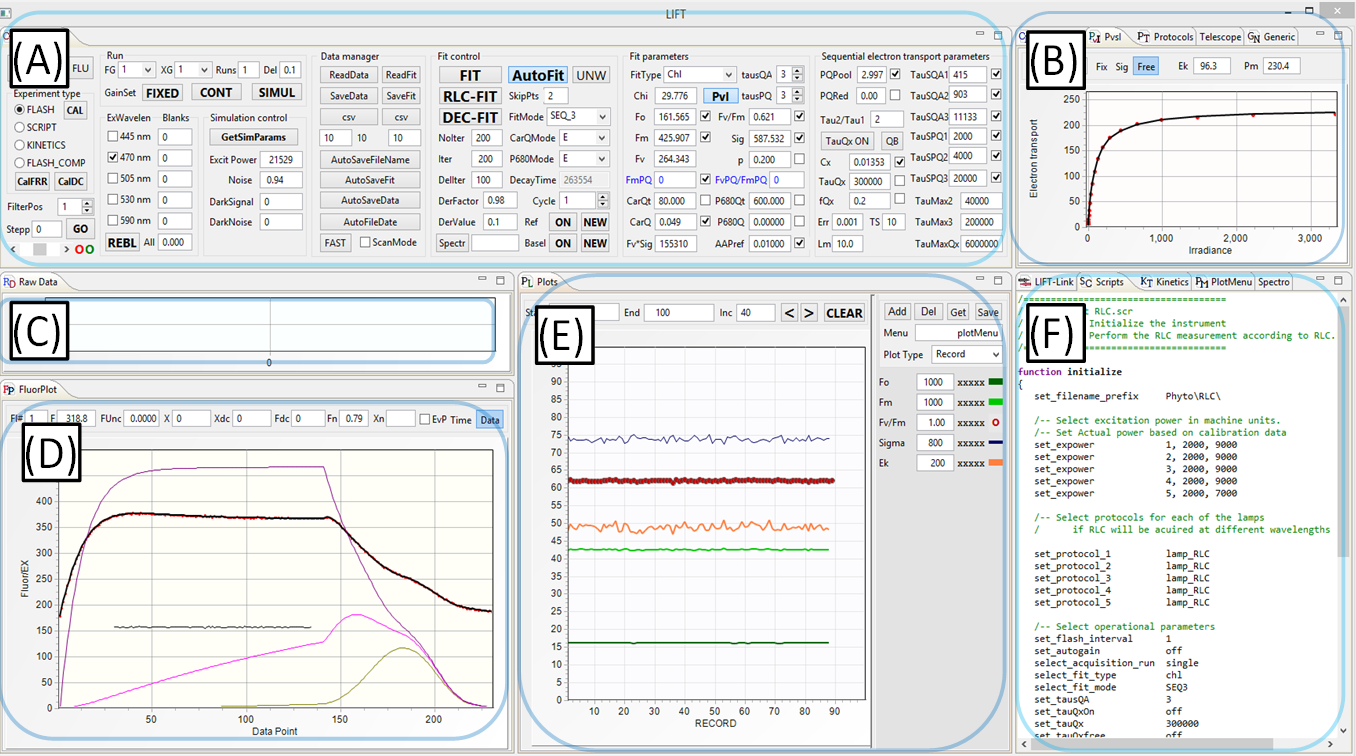
(A) Instrument Control panel
- Selection of operational mode, excitation channels, fitting models, and data management modes
- Initiation of the experiment and calibration procedures
- Initiation of data fitting procedures
(B) Calibration, Protocols, and PvsI panels
- Flash exitation parameters (number of flashlets, flashlet lenghth, flashlet timing)
- Initiation of the experiment and calibration procedures
- Control and display of RLC and ILC fitting procedure
(C) Raw Data Display panel
- Display of raw excitation signal and raw fluorescence signal, one datapoint/flashlet
- Display of raw shape of the excitation flashlets and corresponding fluorescence signal, digitized at 10MHz sampling rate
(D) Calibrated Data Display panel
- Calibrated excitation signal
- Calibrated fluorescence signal
- Noise signal
- Data fit display
- Redox level of QA, QB, and PQ Pool
- Display of total electrons entering and leaving the electron transport chain
(E) Data Plot panel
- Plots of the fitted data
- Plots menu (symbols and colors
- Plotting modes (records, date/time, depth)
- Plot update modes
(F) Communication, Scripts, Kinetics, and Plot menu panel:
- Data communication control and monitoring
- Programming script for automating instrument operation(5)
- Programming scripts for DC light manipulation
- Plots layout and management
(5)Script-based operation allows programming a sequence of measurements/experiments, including instrument initialization, selection of excitation protocols, data management, and fitting procedures.
Instrument Operation
Excitation protocols define the number of flashlets and their timing in the excitation sequence.
They are specified in the editor section of the protocol panel (A).
Usually, LIFT/FRR excitation protocol consists of the saturation sequence, with flashlets applied at high repetition rates, as specified in the first line of the protocol:
flash 300, len 1.6, del 2.5, inc 1.0
- make 300 flashlets
- set flashlet length to 1.6 μs
- set flashlet interval to 2.5 μs
- keep flashlet interval constant,
followed by a relaxation sequence specified in the second line of the protocol:
flash 127, len 1.6, del 30, inc 1.025
- make 127 flashlets
- set flashlet length to 1.6 μs
- set initial flashlet interval to 20 μs
- increase interval by exponential factor of 1.025.
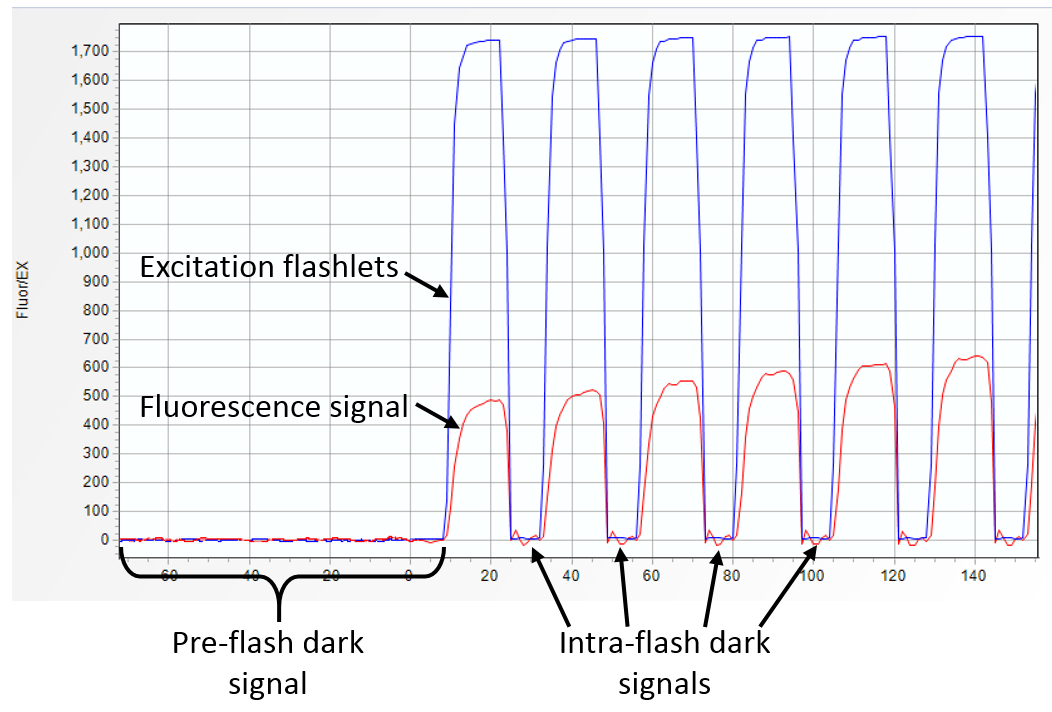
A graphical representation of the excitation protocol is displayed
in the graph section of the protocol panel. The fluorescence transient produced by this excitation protocol is shown as a function of time (B), and as a function of flashlet number
(C).
Depending on the power and the length of saturation sequence, we define the LIFT excitation flash as
QA flash or PQ flash. In the saturation portion of QA flash (SQA)
the excitation power is selected at a level sufficient
to reduce QA to more than 90% level while minimizing electron flow to PQ Pool. In the saturation portion of PQ flash (SPQ) the excitation power is ~ 10 times lower,
but applied over ~100 times longer period to reduce PQ Pool.
This sequence of QA-PQ flashes can be generated with the following four lines of excitation protocol:
flash 300, len 1.6, del 2.5, inc 1.0
flash 127, len 1.6, del 30, inc 1.03
flash 6000, len 1.6, del 20, inc 1.0
flash 300, len 1.6, del 2.5, inc 1.03
Arbitrary sequences of flashes can be programmed by just repeating protocol directives
in the excitation protocol editor. Applying such flash sequence to a 60-seconds dark adapted lemon tree leaf (upper transient) generally results in the first flash displaying
~25% higher Fmax than the subsequent flashes. The same protocol applied in presence of 5 μmol quanta m-2s-1 IR
light produces fluorescence transients with roughly similar Fmax. This observation suggests possible control of PQ pool reduction level on the fluorescence yield.
A QA-PQ-QA flash sequence can be programmed by extending the length of saturation
sequence in second flash to ~7,000 flashlets at time interval of 25 μs. Observe about 2-times increase in the fluorescence yield at completion of the PQ flash, and about
30% higher fluorescence yield in the second QA flash.
NOTE: Examples of LIFT/FRR protocols presented here are to demonstrate the flexibility of the instrument excitation protocols.
Although they may serve as a templates (the instrument software is pre-loaded with these templates), actual applications may require modifying these protocols to satisfy user requirements.
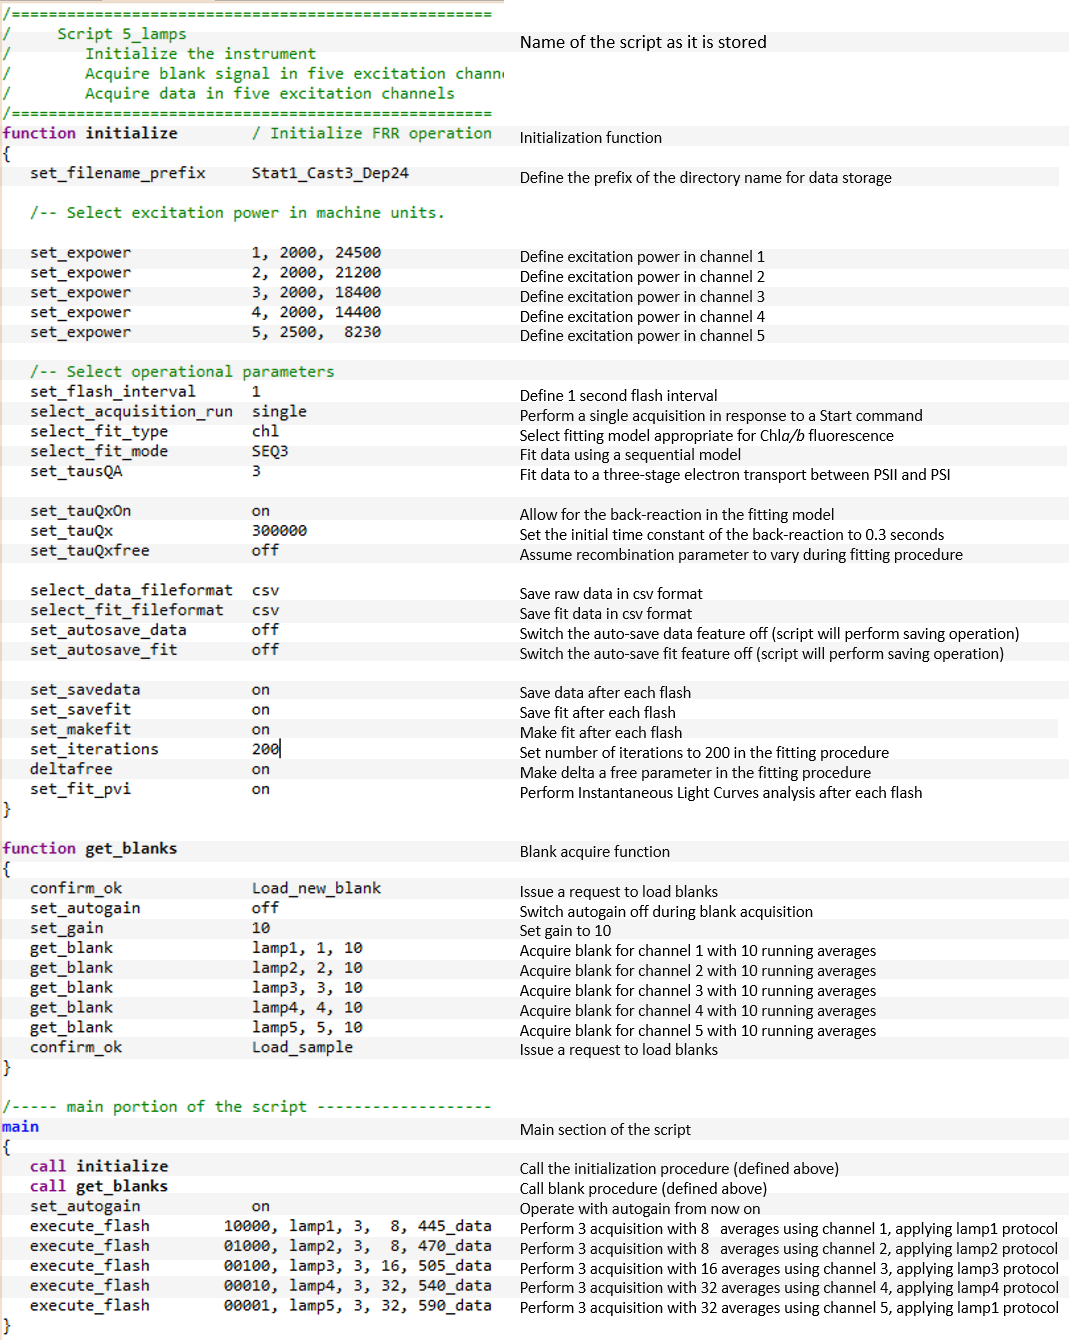
Instrument control can be performed entirely from the user interface panel. The automated mode of operation, however, is best managed by the LIFT/FRR Execution Scripts (LES).
These scripts define the instrument initialization procedure, selection of the excitation channels and excitation power, sequence of control commands,
and data management. Scripts can be designed to perform various experiments, including single acquisition, timed sequence of acquisitions,
and continuous/indefinite loops of instrument operations. All instrument functionality, including acquisition of blanks and acquisition of fluorescence transients,
data processing, and data management can be implemented in LES. An example FRR script presented above is used to initialize the instrument,
acquire blank signal in five excitation channels, and perform a series of measurements in five excitation channels.
The script presented here displays just a subset of the LIFT/FRRF commands.
The entire command list is presented in the LIFT/FRR Manual pages.
The LIFT scripts can call other scripts, allowing a hierarchical structure of instrument control, up to five levels deep.
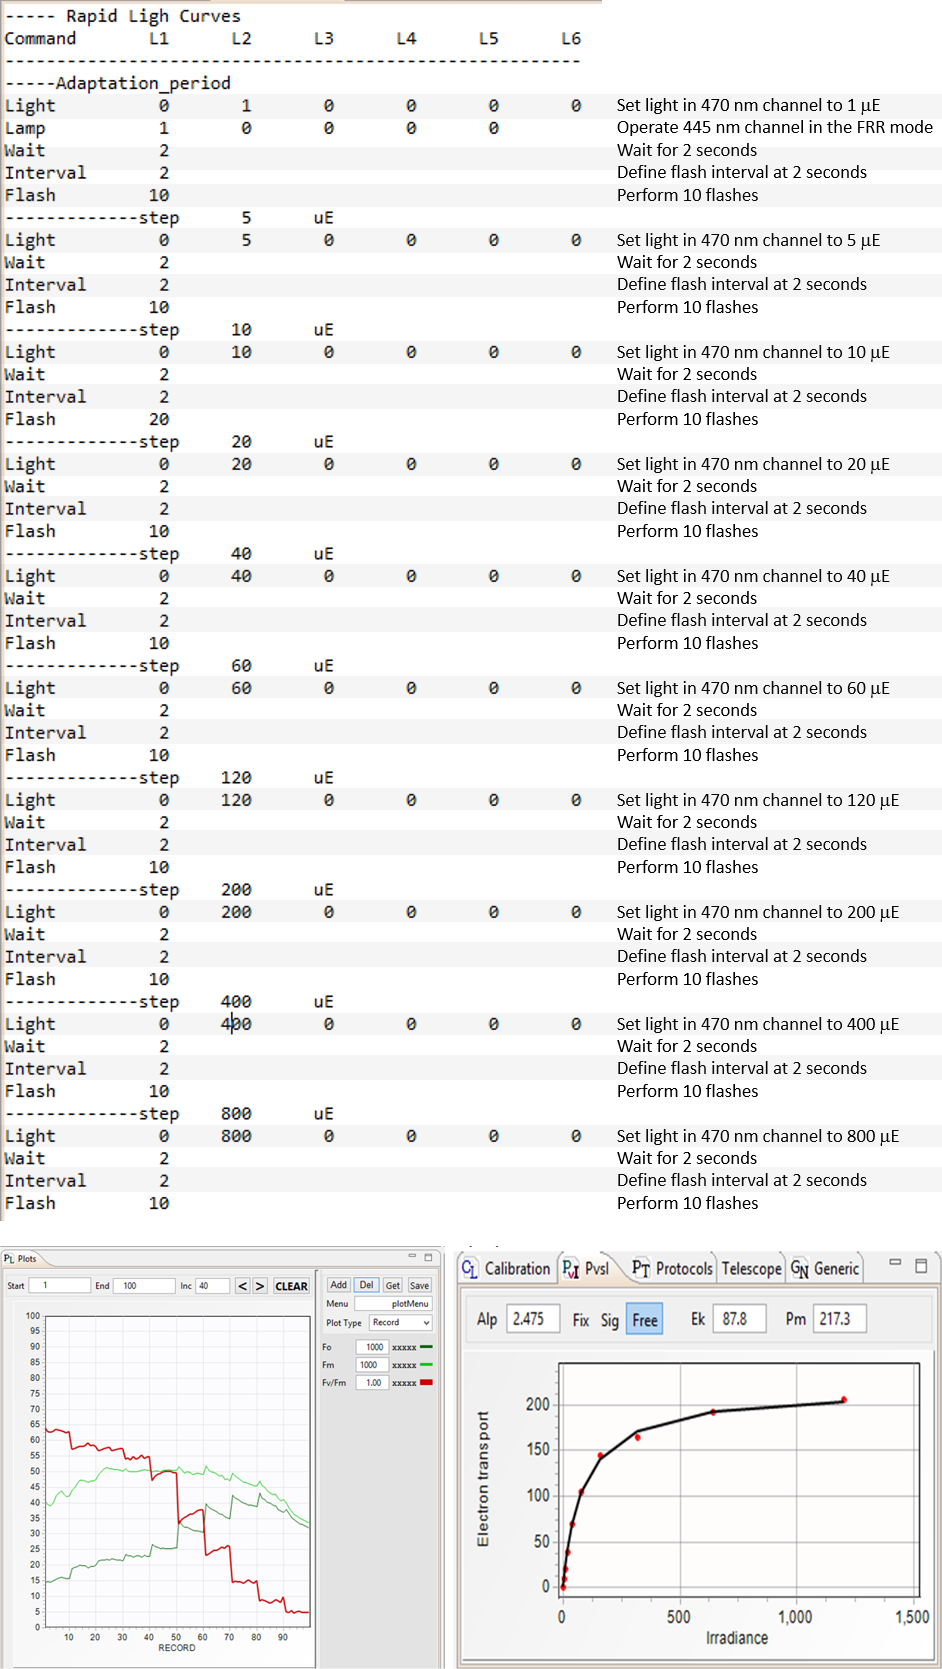
LIFT Kinetics scrips (LKS) are used to control DC illumination regime during LIFT/FRR measurements. These scripts are used for acquisition of RLC (Rapid Light Curves),
assessing the extent and the dynamics on non-photochemical quenching, and for performing a range of light manipulation experiments that require synchronizing
the FRR flashing sequence with control of the ambient light level. Depending on the version of the LIFT/FRR instruments, up to 15 DC illumination channels (five FRR channels, one IR channel, and 8 optional excitation channels)
are controlled by these scripts. An example of the kinetics script shown here was used to perform an RLC experiment with results shown below. The initial "dark adaptation" period was performed in presence of μmol quanta m-2s-1 of blue (445nm) nm light
to prevent excessive reduction of PQ Pool in the darkness prior the measurements.
The kinetics scripts can be performed using the control panel of the LIFT/FRR software, or can be called from the LIFT/FRR execution scripts described in the previous section.
The latter mode of operation is more preferable since LES can perform all the instrument initialization operation, thus preserving the consistency of the experimental conditions.
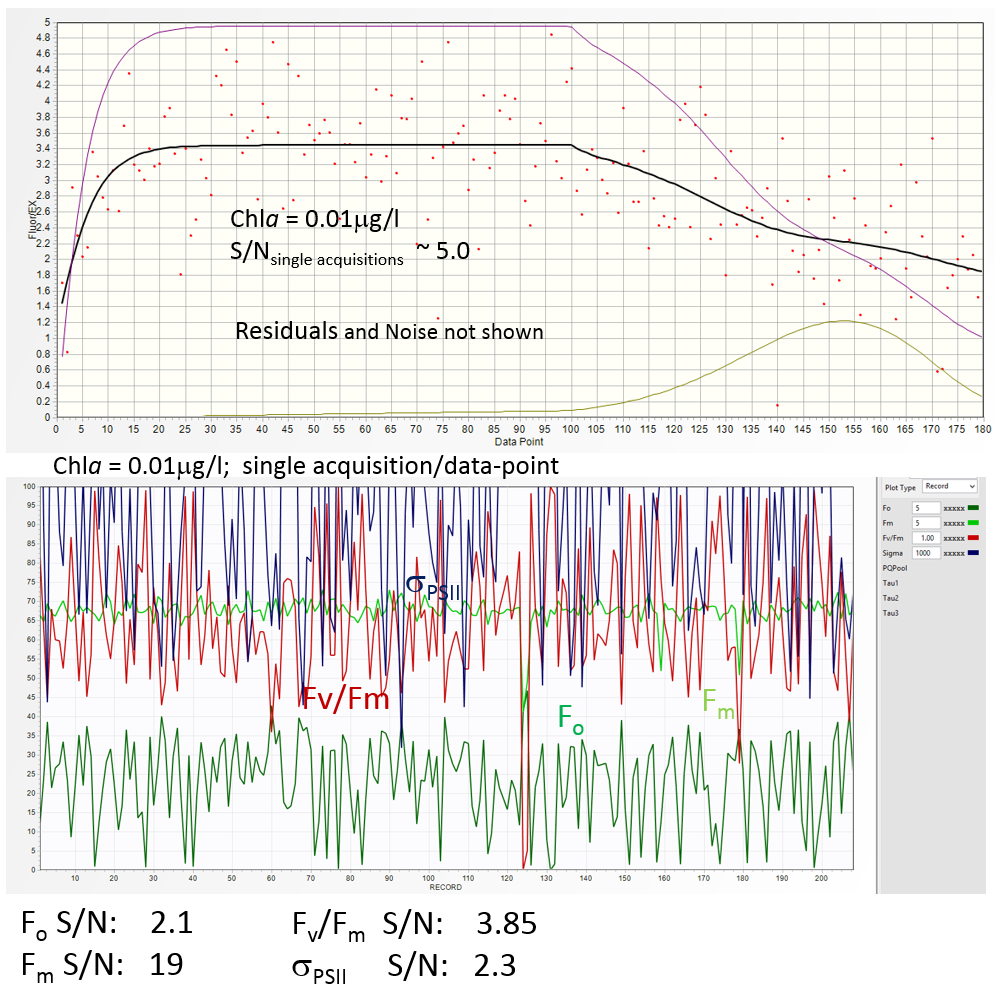
Instrument sensitivity is determined by the lowest in vivo Chla concentration required for performing FRR measurements.
This definition, however, is meaningless without specifying the associated Signal-to-Noise (S/N) ratio.
We define this parameter as a ratio of the fluorescence signal in the saturation portion of fluorescence transient to the standard deviation of the recorded signal.
The S/N ratio in the raw data is calculated after each acquisition, automatically updated when performing running averages. It can be used to estimate the statistical quality
of the calculated photosynthetic parameters.
Current version of Soliense FRR instruments operates with S/N ~5 at in vivo Chlaconcentration of 0.01 μg/l .
With such S/N in the raw data, the Fm signal is recovered with S/N ratio of about ~19 due to the fact that the entire fluorescence transient, not just the saturation portion, is used in
the fitting procedure to calculate Fm. Theoretically, the Fm signal can still be recovered at 20 times lower Chla concentration with some signal averaging. This sensitivity can pushed further by extending the length
of the saturation sequence.
Calculations of Fo, however, is much less constrained (Fo is mostly defined by several data points at the beginning of the saturation sequence), yielding S/N ratio of only 2.1. The S/N ration in Fv/Fm
estimates is about 4 (marginally acceptable), but the S/N ratio in σPSII is only 2.3, similar to the S/N in Fo (unacceptable in our opinion).
Our experience indicates that S/N ratio of at least 25-30 is required to make
statistically-viable estimates of Fo, Fv/Fm, and σ PSII . This S/N can be achieved by
performing 32 running averages, increasing S/N by a "theoretical" factor of 5.6.
As a result, the S/N ratio in estimates of Fv/Fm, and σ PSII increase by roughly the same factor, while S/N in Fm and Fo estimates
increases by twice as much.
Another approach toward increasing the S/N ratio is to produce a series of flashes in a quick sequence (see the section
about excitation protocols above), and analyze all these flashes simultaneously.
The "engineering limits" of instrument sensitivity are defined by the intrinsic noise of the detector (so called Noise Equivalent Power, or NEP), by the performance of instrument electronics, and by the quality of signal processing.
These limits will be pushed further as the technology will advance. The practical limits are defined by a
presence of at least one cell in the sample chamber. In case of large, 20-40 μm diameter cells
single-cell measurement are possible without data averaging. In case of heterogeneous population,
when different organisms (or organism assemblages) are interrogated at each flash, low flash-to-flash repeatability may be observed in calculated parameters
despite high S/N ratio in the raw fluorescence transient. The practice of real-time assessment
of S/N ratio in acquired fluorescence transients allows identifying such cases of "biological" variability in the measured sample.
"Blanks" in the FRR measurements can be classified as
- Dark signal due to the "dark current" generated by the instrument detector and by the instrument electronic offsets, present in the absence of the excitation signal.
- Instrument blanks due to portion od the excitation light entering the fluorescence emission channel.
- Sample blanks due to the presence of optically-active dissolved organic matter in the sample (a fluorophore that is excited by the FRR excitation signal and shows fluorescence/luminescence signal at the fluorescence emission wavelength).
The instrument blank is collected using MilliQ water, usually at instrument gain of 10, and then scaled up or down based on the actual instrument gain. This blank accounts for scatter signal due to the leaking of excitation light to the emission channel, and for the systematic electronic noise induced by the rapid switching of the excitation light sources. Instrument blanks are collected at each channel, and are stored in the instrument calibration file. This file is read and acted upon each time the instrument is powered ON.
The sample blanks are measured using sample filtrate, usually using GFF filters. The FRR execution scripts (see the section above) contain procedure for automatic collection of sample blanks at each excitation channels. After collection, the blank fields in the instrument control panel are populated with the blank values, and will remain in effect until the next blank acquisition. The instrument blanks and sample blanks are additive. When instrument blanks are not present (or set to zero), sample blanks will account for both the instrument blanks and for the presence of dissolved fluorophores in the sample. It is a good practice, however, to have the instrument blanks assessed before taking sample blanks. Sample blanks, measured on the top of instrument blanks, provide valuable information about the distribution of some CDOM in the water column. More important, independent assessment of instrument blanks and the sample blanks will provide information about the relative contribution of these two components to the total blank. Choice of Milli-Q waters for measuring instrument blanks is somewhat arbitrary. Milli-Q water still contains residues of optically-active active compounds. Sample blanks from open ocean water collected from 500-1000 meters depth are sometimes "cleaner" than Milli-Q water. Negative values of sample blanks acquired on top of instrument blanks are not uncommon in situations when Milli-Q based blank measurements overestimate the actual instrument blanks.
Controlling the blanks
High blank values, even when correctly acquired and applied, will compromise the quality of FRR measurement at low sample concentrations by limiting the dynamic range of the instrument.
Although sample blanks cannot be controlled, instrument blanks can be minimized by optimizing the optical paths of the excitation and the emission channels, by use of appropriate excitation and emission filters,
and selecting "clean" glass for the instrument sample chamber.
Best practices in acquiring sample blanks
Usually sample blanks are collected as sample filtrates using GFF filters. To avoid breaking the cells, the filtration rates should be kept below 4 ml/minute. Use of motorized syringe, or gravity-fed flow usually produce more reproducible results compared to vacuum-driven filtration. If the latter is used, filtration should be terminated before air is drawn through the filter, as this can lead to cell breakage and leaking the cellular pigments into the filtrate. Usually, 15-20 ml of the filtrate is sufficient for blanks assessment (two washes plus the final blank sample). The quality of the filtrate needs to be assessed by observing the shape of the fluorescence signal acquired with the filtrate. This shape has to be absolutely flat. Any indication of the fluorescence transient in the filtrate indicates presence of small cells, requiring repeating the blank preparation with 0.2 μm filter.Blanks distribution in the water column
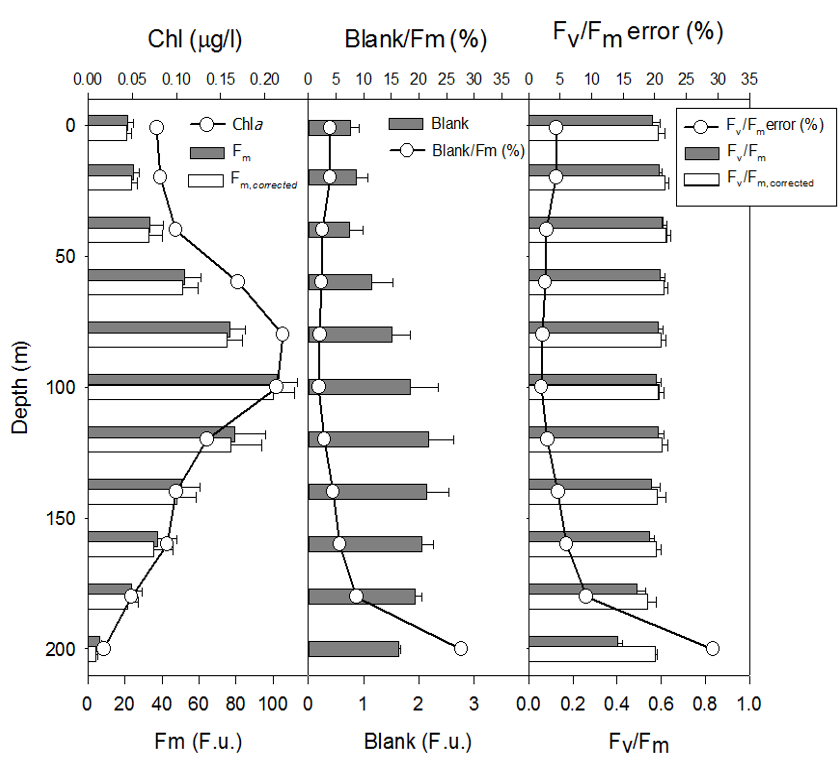
Typical patterns of sample blank distribution in the open ocean water column (600 km east of California Coast) display a minimum at the surface, averaging between 2 to 4% of Fm, increasing
with depth in proportion to Chla concentration down to position of Chlamax.
Below the Chlamax, the blanks signal generally stabilize at a level observed at Chlamax position, or decrease with depths down to to 200 meters.
The decreasing trend generally continues with depths, reaching a minimum
level at 500 - 700 meters, with the blank levels sometimes lower than that measured with Milli-Q water. Below 500-700 meters this trend generally reverses, with blanks increasing slightly with depths.
The ratio of the blank signal to the Fm signal, however, increases sharply below Chlamax, to a level of 30-40% at depth of 200 meters. As the Chla concentration decrease below 0.005 μg/l,
this ratio becomes meaningless due to vanishing Chla concentrations.
Not accounting for the sample blanks produces errors in estimates of Fv/Fm, under-estimating "true" Fv/Fm by a fraction roughly proportional to the ratio of sample blanks to Fm.
At the surface this error ranges between 2 to 5%, increasing below the depths of Fv/Fm, with the errors reaching 30 to 40% at 200 meters depth.
Blanks acquisition is the most mundane and the most error-prone procedure in FRR processing of the water samples. The script-assisted procedure offers some help, but the values of acquired blanks need to be scrutinized
for a presence of unexpected departures from the basic patterns described here:
- Between surface and the position of the Chlamax (or Fm, max) blank values are generally proportional to Fm signal
- Below the depths of Chlamax (or Fm, max) blank values generally decrease slightly, while the fraction of blanks relative to Fm increase sharply.
- Blanks/Fm ratio is relatively constant between surface and the position of Chlamax (or Fm, max).
Blanks distribution at the ocean surface
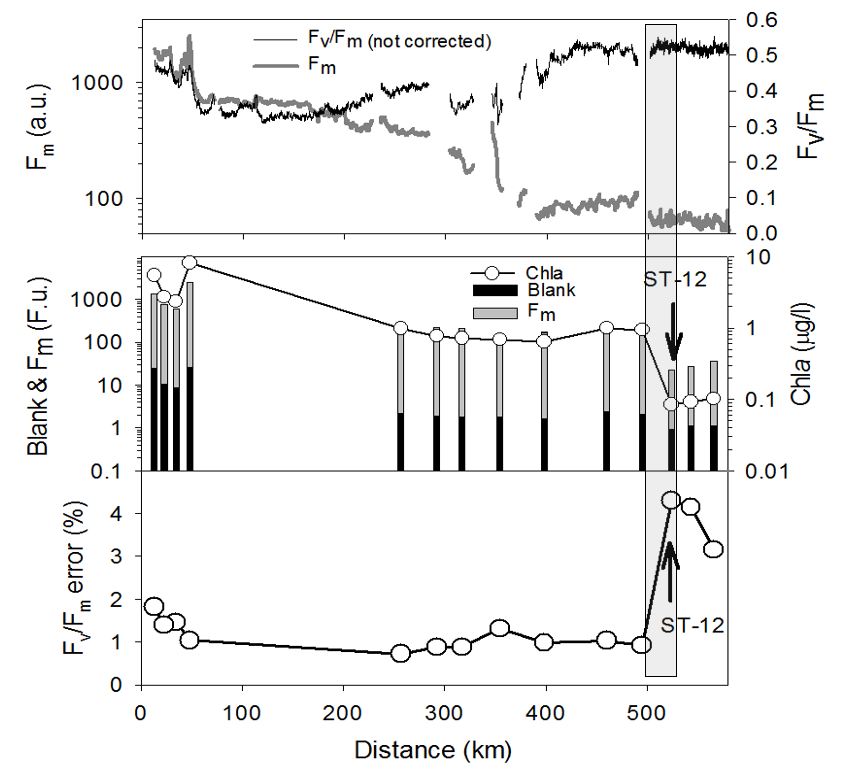
The amplitude and the variability of the blank signal at the ocean surface is of critical importance for FRR underway operation, where acquisition of blanks for each sample is impractical.
The blanks/Fm in the ocean's surface average at 2% to 4%,
but may occasionally spike in front areas (see the figure on the right), or within strongly upwelling eddies. The corresponding
error in estimates of Fv/Fm without accounting for the sample blanks are are generally similar to the blank/Fm ratios. These ratios along the 600 km transect west of California coast,
across quite diverse water masses with Chla concentration changing by two orders of magnitude, were less than 2%, but spiked to 4.5% at the front 520 km offshore. Assuming that the sample blanks can be assessed once/day (a regular maintenance
periods for cleaning the sample chamber of the underway instrument), the error in estimates of Fv/Fm can be kept at less than 2%. In most of the open ocean application this is practically the precision limit of
FRR-based estimates of Fv/Fm (see the section on instrument sensitivity and S/N ratio).
NOTE: Among photosynthetic parameters assessed by FRR fluorometry, sample blanks affect the estimates of Fo, Fm, and Fv/Fm. Calculations of other parameters
is not affected by sample blanks.
FRR Applications

Example of FRR-derived section of photosynthetic properties along one of the transects
across the North Atlantic shelf reveals close relationship between the physical and chemical
structure of water masses (left column) and the photosynthetic characteristics (right column). In this example, upwelling of cold, nutrient-rich water about 100 km off-shore supports
high photosynthetic yields and functional absorption cross section, resulting in local accumulation of chlorophyll biomass. FRR-derived primary production shows high level of coherence
with oxygen concentration.
Similar picture was observed in an open ocean section
across a local chlorophyll feature in the North Pacific Subtropical Gyre
with spatial correlation between locally upwelled nitrogen (NO3 + NO2), local maximum in the photosynthetic efficiency as indicated by high Fv/Fm,
and high chlorophyll biomass as indicated by high Fm signal. The surface filament of high Chla, visible from space, also correlated spatially with high Fv/Fm and Fm.
Spectrally-resolved photosynthetic properties allow discriminating between different phytoplankton taxa based
on composition of their photosynthetic pigments. Relative presence of green-absorbing organisms (D) shows local maximum at a time when Trichodesmium bloom was detected.

LIFT-FRR instrument can operate in a continuous underway mode using the flow-through sample chamber and the integrated, software controlled pump.
Surface transect through a Trichodesmium-dominated area in NPSG demonstrates the ability to continuously acquire
photosynthetic properties of phytoplankton with spatial resolution of about 40 meters. Acquired transect shows local increase in the
Fv/Fmsignal, a decrease in the functional absorption cross section typical of cyanobacteria, and about two-times increase in chlorophyll biomass,
punctuated by spikes of Fm signal while crossing local filaments of surface blooms of Trichodesmium.
LIFT-FRR instrument was operating for a
period of 2.5 years onboard TARA sailboat, continuously acquiring data along cruise track. Spectrally resolved FRR data revealed striking differences
between the spatial distribution of
blue-absorbing species and the green-absorbing species. These differences were even more pronounced on local scales,
as observed off the coast of Chile.
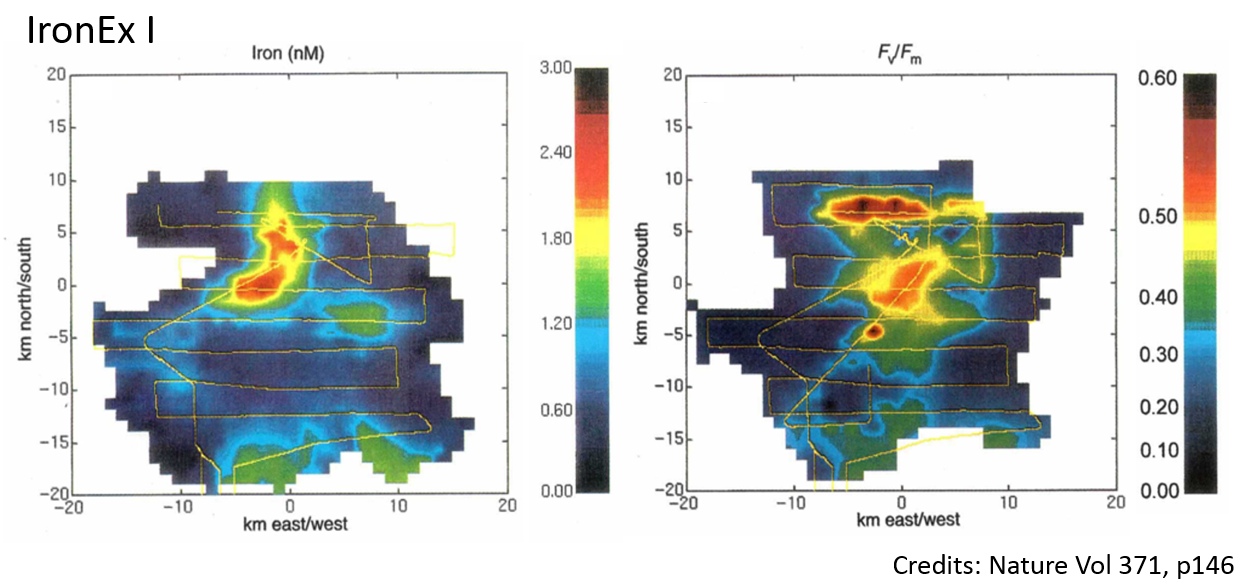
FRR instruments were used in most of the open ocean iron enrichment experiments.
FRR-based observations during IronEx 1 experiment produced the earliest data on the effects of iron
on the photosynthetic efficiency of marine phytoplankton in the open ocean environment, supporting a hypothesis of bottom up limitation of iron on phytoplankton physiology in all size classes.
The observations of very fast, but transient response of phytoplankton photosynthesis aided in a design of IronEx 2 experiment,
where the same amount of iron was added in three allotments separated by several days,
producing much stronger and longer-lasting response. Use of FRR technique in subsequent experiments,
including SOFeX, further confirmed the role of iron
in controlling the photosynthetic performance of marine phytoplankton.
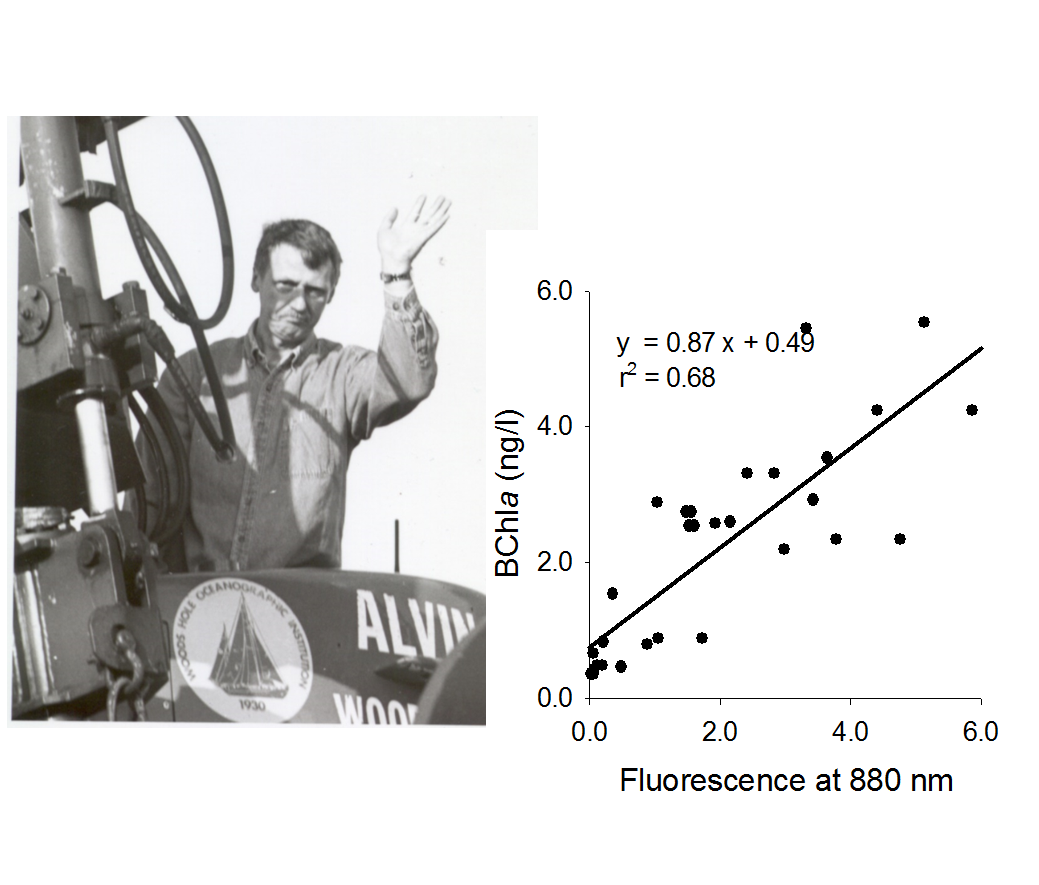
Using emission signal at 880 nm, LIFT-FRR technique can be applied to detect and quantify the presence of Anoxygenic Aerobic Photoheterotrophs (AAP),
a class of bacteriochlorophyll-containing bacteria capable of aerobic respiration and facultative phototrophy. Despite of reported presence of these organisms
at deep sea hydrothermal vents,
the effort to detect AAP presence at 9N hydrothermal vents failed. The AAP-specific signal, however,
was consistently detected at the surface waters, with BChla concentration averaging at 3 ng/l with BChla peaking at depth of about 60 meter in the open ocean.
A surface survey along 1000 km transect from 9N Vents to the coast of Mexico displayed
wide range of BChla concentrations, with BChla/Chla ratios varying from 0.7% to 4.5%.
Following these observations, AAPs presence was found ubiquitous in the surface oceans,
with plenty of strains cultured and isolated.
NOTE: AAPs absorb light at ~380 nm (BChla absorption band) and in 480-520 nm range (carotenoids absorption band).
As the short-wave light is quickly absorbed in the water column, it is mostly the green light that drives AAPs photosynthesis. Although the BChla signal can be be excited by the blue light,
use of green light (505 nm) is more preferable because it results in lower long-tail Chla emission at 880 nm. Since the Chla emission at 880 nm can still be substantial, proper assessment of BChla requires
recording the Chla emission at 685 nm, and assessing the fractional presence of this signal at 880 nm based on temporal character of the Chla transient
(~10 times higher functional absorption cross section, resulting in 10-times faster saturation). Automatic acquisition of the 685 nm and 880nm transients is made possible
by using the software controlled filter wheel of the instrument.
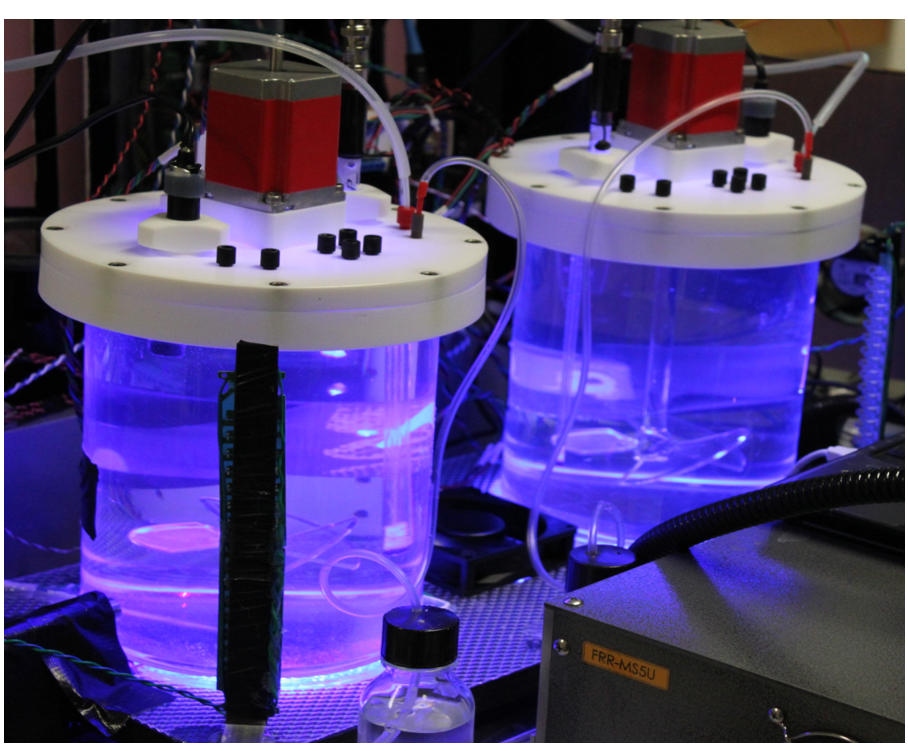
SoMeC is a microcosm-scale platform for observing responses of marine microbial population to environmental perturbations. It is being designed as a two-vessel chemostat with precisely controlled energy and nutrients delivery. Integrated two-channel LIFT/FRR fluorometer, operating with four excitation wavelengths (445 nm, 470 nm, 505 nm and 535/590 nm) and six emission wavelengths allows monitoring photosynthetic properties in each vessel with 1 second temporal resolution. Eight DC excitation channels, and a two channel spectrometer are used to provide more detailed information about presence of optically-active compounds. Each vessel is equipped with
- Temperature, Oxygen, pH, and CO2 sensors
- Four sampling ports
- Two software controlled, stepper motor-driven pumps
- Three flow-mass controllers for controlling Nitrogen/Argon, CO2 (pH), and air mixture
- Thermo-electric heat exchangers for temperature control in range of 5°C to 40°C
- Magnetically-coupled low-speed paddle mixer to operate with fragile cells and cell colonies (Trichodesmium trichomes, puffs, and tufts).
- Software-controlled, collimated RBGW illuminator with irradiance level up to 4,000 μmol quanta m-2s-1
The physical size (700 mm x 512 mm x 360 mm) makes the system applicable for sea-going expedition (fits into Pelican 1630 case).
Prototype SoMeC design, assembled on the bench,
was used to perform a series of experiments with Crocosphaera watsonii, a nitrogen fixing cyanobacterium
with unusual patterns of photosynthesis and nitrogen fixation.
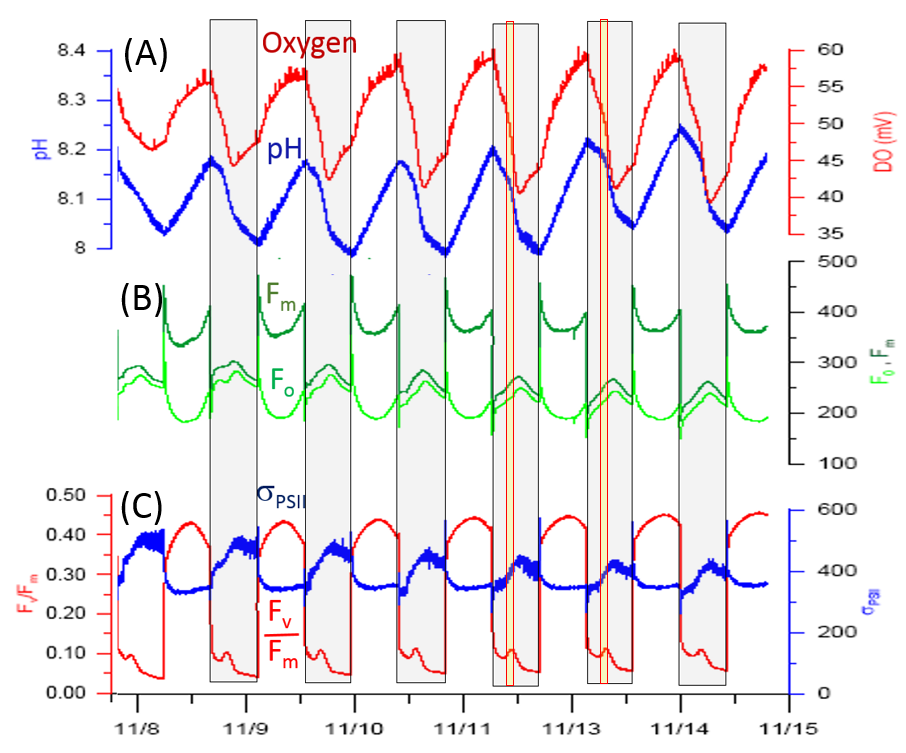
The Fv/Fm signal in this organism collapses within 5-10 minutes after switching the light Off, most likely due to over-reduction
of PQ pool by respiratory electrons derived from organic carbon. About 4 to 6 hours into the darkness Fv/Fm displays a characteristic blip
coincident with onset of nitrogen fixation, with rates of oxygen consumption and CO2 production increasing by a factor of 2 to 3,
as judged by the change in the slope of oxygen and pH plots. The appearance of this blip is most likely caused by
(a) accelerated withdrawal of electrons from PQ pool toward terminal oxidase to satisfy the increased energy demands of nitrogenase activity, and (b) lessening of the reduction pressure
on PQ pool by diverting portion of the respiratory electrons toward pyruvate-ferredoxing oxidoreductase (PFOR) pathway to satisfy nitrogenase requirements for electrons.
Activation of PFOR pathway also explains enhanced accumulation of CO2 leading to pH drop, while the subsequent acetyl-CoA → acetate pathway may
further supplement the energy requirements of nitrogenase.
NOTE: Dark nitrogen fixation in Crocosphaera necessitates that electrons required to operate nitrogenase are provided by pyruvate-ferredoxin oxidoreductase (PFOR)
pathway as PSI is inactive in the darkness.
Within the next few hours the cellular energy requirement and oxygen consumption decrease, and oxygen concentration
equilibrates toward the ambient level. The amplitude of the nightly Fv/Fm blip increases in proportion to the irradiance level experienced during the previous day,
indicating that pools of organic carbon stored during the day determine the allowable energy and electrons expenditure for nitrogen fixation during the following night.
The "dark nitrogen fixation" strategy presumably diminishes the deleterious effects of oxygen on nitrogenase activity.
Similar pattern of photosynthetic activity and nitrogen fixation is observed under a
more realistic irradiance regime.
The circadian cycle of nightly PQ pool over-reduction and enhanced respiratory activity
is preserved for several days after switching the light regime to continuous illumination.
Nitrogen fixation still continues with the entrained circadian rhythm,
temporarily displaying higher daily-integrated nitrogen fixation compared to typical light/dark cycle.
This increase may be explained by continuous supply of energy and reduction power in the light, coupled with circadian-driven respiratory oxygen consumption.
The ultimate performance of microbial assemblages is defined by their genomic blueprints. Our chemostat device
is designed to serve as a racetrack to quantify the actual performance under varying environmental conditions. Corresponding changes in this performance, observed in real-time, may
serve to inform sampling strategy to investigate underlying patterns of gene and protein expression. Concentrating sampling effort on particular features
(the sudden collapse and reappearance of the Fv/Fm signal at light-Off and light-On transition,
or presence/absence of the Fv/Fm blip at onset of nitrogen fixation in the Crocosphaera example above)
may accelerate the inquiry of molecular origins of these phenomena, while quantifying their photophysiological effects.
There is another, less practical, yet very interesting application.
It is hypothesized that collective genome of local ecosystems encode their organization and their biogeochemical performance as a whole, driven by general "principles"
of Maximum Energy Utilization (MEU) or Maximum Entropy Production (MEP). Following this notion, ecosystems evolve and self-organize,
on levels of species composition and the biochemical pathways they contribute, to maximize their entropy production.
Local loss of entropy due to self-organization and information storage is more than offset by the increased efficiency of entropy dissipation into environment.
The acquired “skills and knowledge” are passed to next generations, ensuring that continuously-improving, biotic-driven rates of entropy production
will sooner or later exceed the abiotic rates defined by the static laws of physic and chemistry.
Such “principles”, if present, would determine the trajectories of ecosystem response to environmental changes, simplifying the prediction and modeling of their future behavior.
For now, the presence and the hierarchy of such "general principles" remain highly hypothetical, if not speculative.
Oceanic microbial communities represent best experimental subjects to investigate this question due to
coexistence of phototrophic and heterotrophic assemblages, fast rates of carbon exchanges, short generation times, small required experimental infrastructure,
and the feasibility of being observed at high level of details.
On the other hand, the design of the SeMoC platform, with flexible and accurate means of energy delivery, ability to quantify substrates/products exchange with the environment
(organic carbon, NO2/NO3/NH3, CO2, O2, N2), and precise temperature control makes all
"entropy-related" parameters and variables accessible and measurable.
The two-vessel configuration allows to observe differential effects of selected treatments.
Also, this configuration allows operation as a pair of open vs closed system, or biotic vs abiotic system.

We would like to acknowledge the support from US Department of Energy and from NASA for development of fluorescence-based techniques to study photosynthesis. We are also indebted to prof. Paul Falkowski, Rutgers University, for the long-lasting support, deep scientific insight, and limitless knowledge of photosynthesis (among other disciplines of science). A truly remarkable teacher and researcher, Paul inspired scores of students and scientists to develop and use new methods and techniques for inquiry of photosynthesis. Several barriers were abolished while new paths in photosynthetic research have been opened because of his intuition and vision. We feel obliged to produce the best experimental tools to further progress on these paths.
Coming Soon (May 2017)
Submersible LIFT-FRR instrument
Submersible LIFT-FRR instrument will utilize 4 excitation channels to project excitation beam in front of a flat, fused-silica window. In a typical configuration the excitation spot will be positioned at 25 mm distance from the window to maximize collection of the fluorescence signal under conditions of low biomass concentration. Version of the instrument designed for coral applications will operate with an excitation spot at 120 mm distance from the window.
Specifications
Photosynthetic characteristics measured
Same as for the bench-top LIFT/FRR instrument
Sensitivity
Our objective is to reach sensitivity down to 0.02 μg/l Chla with (S/N) ratio as specified for the bench-top instrument.
Spectral Range and Excitation Power
- Any combination of four excitation wavelengths: 445 nm, 470 nm, 510 nm, 530 nm and 590 nm( (1)
- Excitation power in FRR mode:
- Similar to that of the bench-top instrument
- Excitation power in DC mode:
- About 60% of the current bench-top instrument
- Up to eight DC excitation channels for assessing presence of photosynthetic/non-photosynthetic pigments (optional)(2).
- Up to 24 discrete emission channels operating in DC mode (optional) (3).
(1) Selection of FRR excitation wavelengths can be further customized to satisfy requirements for selective excitation of
different photosynthetic pigments and can be tailored to user specifications.
(2) Selection of optional DC excitation wavelengths can be tailored to customer requirements.
(3) Selection of optional DC emission wavelengths can be tailored to customer requirements.
LIFT-SUB-1.0
- Cylinder 66 mm OD, 240 mm long, CuAl10NiFe4 alloy housing for biofouling resistance.
- Fused Silica optical window to allow UV excitation/emission.
- Power consumption: estimated at 2-3 W with flash rates of 1/second.
- Power supply: external, 9-24 V. Optional external battery pack.
Base Unit (LIFT-SUB-1.0)
- Four FRR excitation wavelengths: 445 nm, 470nm, 505 nm, and 530/590 nm with software-controlled wavelength selection and excitation power.
- Dedicated laptop computer with preloaded software for instrument programming, data analysis, and data management.
- FRR control software with unlimited, free software updates.
- Shipping case
Options
-
FRR-EX-1.0
Up to 8 DC excitation channels, selected to user specification in range 280 nm - 450 nm. - FRR-EX-1.0
Up to 24 DC emission channels, selected to user specification. - FRR-SUB-MCS
Magnetically coupled swiper/shutter for long-term deployment, CuAl10NiFe4 alloy. - FRR-SUB-BP
External rechargeable battery pack.