Fluorescence/Photosynthetic Properties


LIFT-FRR Method

Basics: Mechanisms of Photosynthesis (Simply speaking...)

  1. Light is absorbed by the photosynthetic pigments (LHCII).
  2. Absorbed excitation energy is transferred to PSII reaction center, promoting charge separation resulting in oxidation of the electron donor, P680, and reduction of the first stable electron acceptor QA.
  3. Electrons are extracted from water and transferred to P680+, resulting in oxygen evolution and protons accumulation in the lumen.
  4. Reduction of QA initiates a process of electron transport from PSII to PSI, mediated by a series of electron carriers (QB, PQ Pool, cyt b6f, and Plastocyanin).
  5. Arriving at PSI reaction centers, electrons are propelled by another process of light absorption toward ferredoxin.
  6. From there, electrons are redistributed among pathways of carbon fixation, cyclic electron carbon around PSI, and in case of nitrogen-fixing organisms, toward nitrogenase.
  7. In Cyanobacteria, respiratory and photosynthetic pathways intersect at the PQ pool, allowing portion of the water-derived electrons to enter the respiratory pathways, and the respiratory electrons to re-enter the photosynthetic pathways.
  8. Protons accumulated in the lumen are pushed toward stroma by the proton gradient, driving ATPase-mediated energy production.

The time constant of QA re-oxidation is modulated by the level of QB and PQ pool reduction, varying from ~150 μs with QB and PQ pool oxidized, to up to 20 ms with PQ pool reduced. With QA in a reduced (or "closed") state, the reaction center cannot accept the incoming excitation, and the absorbed energy is dissipated, increasing the observed fluorescence yield, roughly in proportion to the level of photosynthetic activity. In the LIFT-FRR technique, this activity is manipulating by application of short flashes of light, and the resulting fluorescence transient is analyzed to quantify the photosynthetic characteristics.

LIFT-FRR Fluorescence Transients

LIFT-FRR fluorescence technique employs a sequence of short, ~1μs flashes ("flashlets") to both activate the photosynthetic apparatus and record the resulting changes in the fluorescence yield. In the Saturation Sequence (SQA) flashlets are applied at high duty cycle, with the rates excitation delivery to PSII reaction center far exceeding the capacity of the photosynthetic electron transport. As a result, the observed fluorescence signal rises in proportion to the level of QA reduction as electron transport saturates within 200-600 μs. The initial slope of the fluorescence transient is controlled by the size of light absorbing antenna, by the efficiency of excitation transfer from antenna to PSII reaction center, and by the yield of charge separation. The saturation level of fluorescence signal is defined by the equilibrium between rates of excitation delivery and the concurrent rates of QA reoxidation. Under typical LIFT/FRR excitation power (15,000 to 60,000 μmol quanta m-2s-1), the saturation level of fluorescence transient approaches 90 - 95% of the maximum fluorescence, Fm , with similar level of QA reduction. The Saturation Sequence is followed by the Relaxation Sequence (RQA), where the time interval between flashlets increases exponentially. The average excitation power decreases and the equilibrium between rates of excitation delivery and electron transport shifts toward the latter. The fluorescence signal decreases with a relaxation pattern defined by the kinetics of photosynthetic electron transport from PSII to PSI.

Photosynthetic Signatures (PS)

Functional Absorption Cross Section of Photosystem II (σ PSII)
This property defines the Efficiency of Photosynthetic Light Utilization (EPU) by PSII.
σ PSII is determined by the
  • Size of the PSII-associated light harvesting pigments, or more precisely, by the total number of chlorophyll molecules serving PSII reaction center. This property is generally referred to as the "optical absorption cross section of PSII", aPSII.
  • Spectral composition of the light harvesting pigments. Generally, σ PSII is wavelength-dependent.
  • Efficiency of excitation transfer from pigment bed to PSII reaction center, θ tr. This property is controlled by the architecture and organization of diverse group of Light Harvesting Complexes, by the phosphorylation status of some of these complexes, and by the epoxidation status of some carotenoids within these complexes.
  • Yield of Charge Separation in Photosystem II reaction center Φ PSII: a ratio of stable charge separation events to number of excitation quanta arriving at the reaction center.

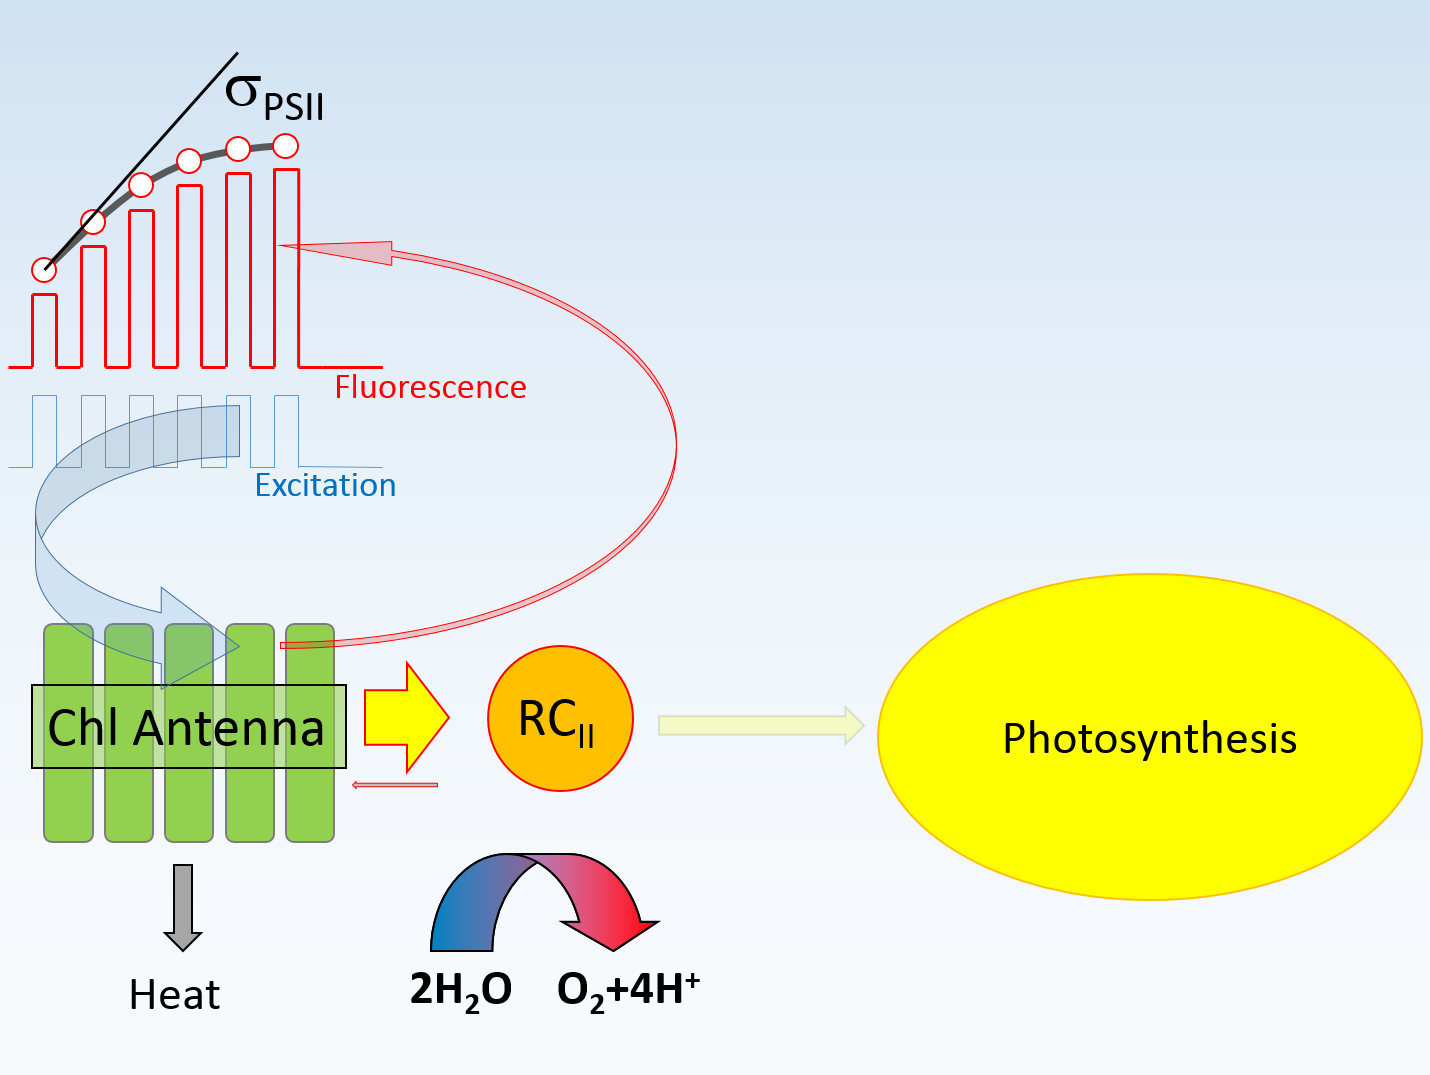
Theoretically, functional absorption cross section can be estimated from the rate of charge separation normalized to quanta flux under conditions of low illumination level. 
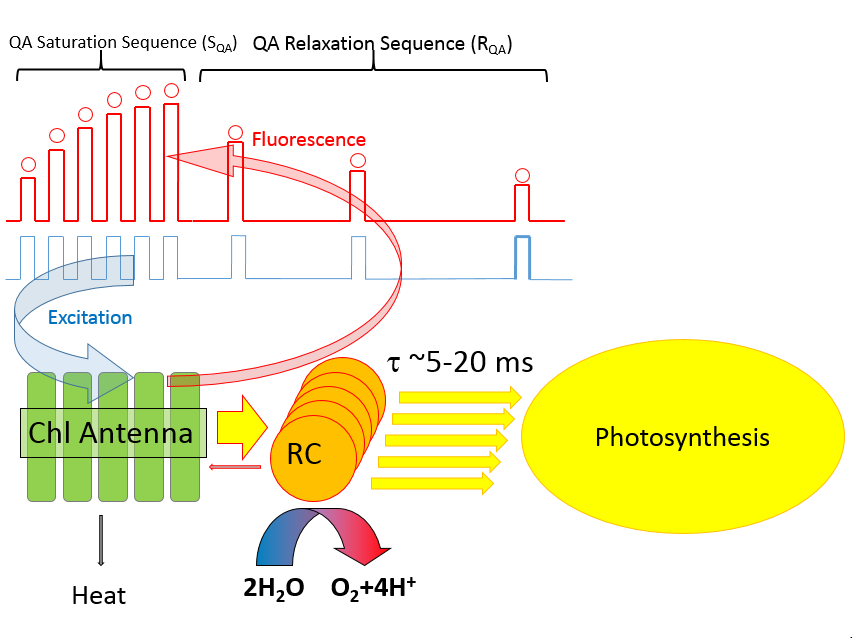
Because rates of charge separation are difficult to measure under steady-state illumination, the excitation signal in LIFT technique is produced as series of high-frequency flashlets (see the previous section), and σ PSII is estimated from the curvature of the observed fluorescence transients. This parameter can be approximated, to a first degree, from the initial slope of fluorescence transient versus excitation energy, normalized to variable fluorescence, Fv. This approximation, however, is only valid under conditions of blocked electron transport between PSII and PSI, and in absence of energy transfer between PSII units. These conditions cannot be satisfied in vivo.

Instead, we calculate the σ PSII by fitting the entire fluorescence transient to a model described by Kolber et. al, 1998. This approach provides simultaneous assessment of the kinetics of the electron transport between PSII and PSI, and quantifies the extent of energy transfer between PSII units. Here are the examples of actual fluorescence transient acquired with marine phytoplankton displaying σ PSII = 423 A2/RCII and σ PSII = 786 A2/RCII, respectively. The initial slope of the fluorescence transient is "roughly" proportional to the calculated functional absorption cross section.


Yield of Charge Separation (Φ PSII)
Yield of Charge separation is defined by the rate of charge separation per unit of excitation quanta arriving at PSII reaction center. This efficiency is generally calculated as a ratio of variable fluorescence to the maximum level of the fluorescence signal.

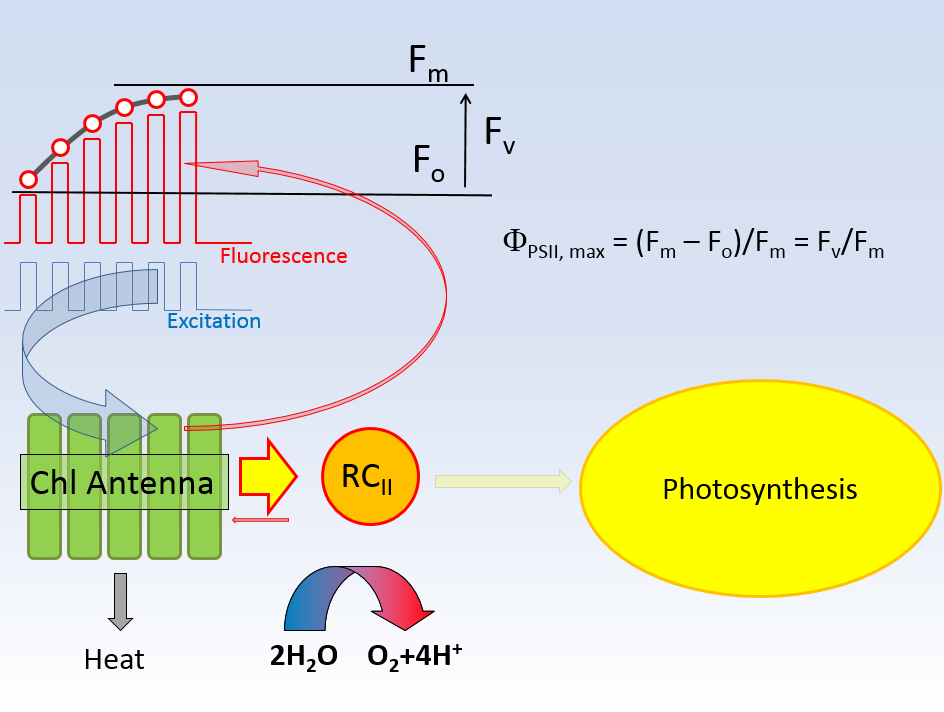
The yield of charge separation attains a maximum value, Φ PSII, max, when the initial level of the fluorescence signal, Fo, is measured under conditions of fully oxidized QA, and Fm signal is measured under conditions of fully reduced QA. These conditions cannot be met experimentally: measurement of the fluorescence requires application of an excitation signal, invariably resulting in some level of QA reduction. Also, full reduction of QA is unattainable in vivo because of a finite level of electron transport from QA to PSII. Nevertheless, applying low-intensity excitation to measure Fo, and strong excitation signal to measure Fm, quite good approximation of the true Fo and Fm signals can be obtained. In the LIFT/FRR method, both these signals are calculated by fitting the fluorescence transient to a model describing the relationship between fluorescence and excitation signal, thus avoiding the problem of "approximate" assessment. The quality of this approach, however, depends on the quality of the models, which also have some limitations.

Another problem is related to the experimental protocols used to perform reduction of QA. Using a QA flash, a high intensity excitation beam is used to reduce QA within 200-800 µs, with negligible electron outflow to PQ pool. In another protocol, a PQ flash with much lower excitation power is applied over longer period of time to progressively reduce PQ pool, with subsequent QA reduction(1). Although these two protocols should reduce QA, there is another factor modulating the maximum level of fluorescence signal, independent of QA reduction. I has been argued that high excitation energy used in the QA flash prevents the fluorescence signal from reaching the maximum level due to the "donor side quenching".
In our opinion this notion is incorrect. Rather, it is the level of PQ pool reduction (or more precisely the level of QB reduction) that determines the final amplitude of the maximum fluorescence yield. To demonstrate that, we apply 
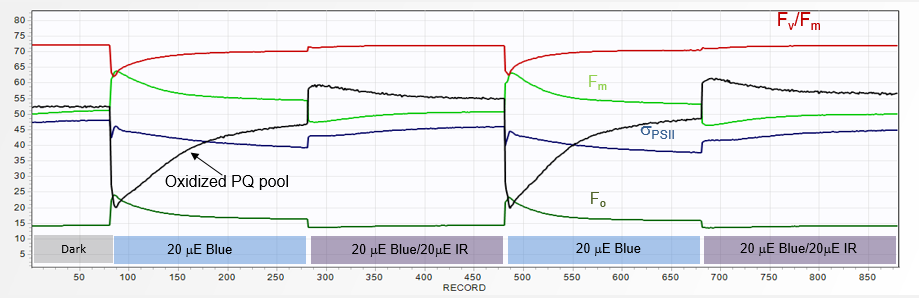
a sequence of QA and PQ flash in presence of 20 µE of IR (730 nm) light. Immediately, the Fv/Fm in the QA flash decreases to a value 0.66, while the PQ-flash signal rises, in proportion to PQ pool level reduction, to Fv/Fm of 0.82. When a pair of two ST flashes is applied following ~1 minute of dark adaptation, the first one generally displays ~25% higher fluorescence yield. As PSI becomes engaged during the relaxation part of this flash, PQ pool reoxidizes, and the maximum fluorescence yield attainable during second QA flash decreases. Again, when these two flashes are applied in a presence of ~ 20 µE of IR (730 nm) light, the fluorescence yield in both flashes becomes equal, with Fv/Fm of 0.63. These observations also indicate that the PQ pool in plants becomes significantly reduced within several minutes in darkness.

Although it is possible, using appropriate excitation protocols, to push the Fv/Fm signal to a level of 0.9 and beyond, the utility of such exercise appears to be of little value in assessing the "correct" value of Φ PSII, max. Much more interesting question is what controls the variability of the Fm signal, what information it provides, and how this control is affected by the environmental conditions. The LIFT/FRR technique, by operating with QA flashes and PQ flashes allows addressing these questions. This effort, however, may be of little relevance for assessing Φ PSII under conditions of engaged electron transport between PSII and PSI.

(1)The QA and PQ flashes were earlier referred in the literature as single-turnover (ST) flash and multiple-turnover (MT) flash. While the definitions of PQ and MT flash are equivalent, the practical implementation of the QA flash generally produce a little bit more than a single electron per PSII reaction center. To avoid confusion, we use the term "QA flash" to indicate excitation condition resulting in reduction of QA with minimal (less than 10%) electron transfer to the PQ pool.


Kinetics of Electron Transport
It is generally expressed in term of rate constants, or time constants of electron transport through a series of electron carriers from PSII to PSI. We have decided to use time constants as they better reflect the dynamics and the time-scales of photosynthetic electron transport.

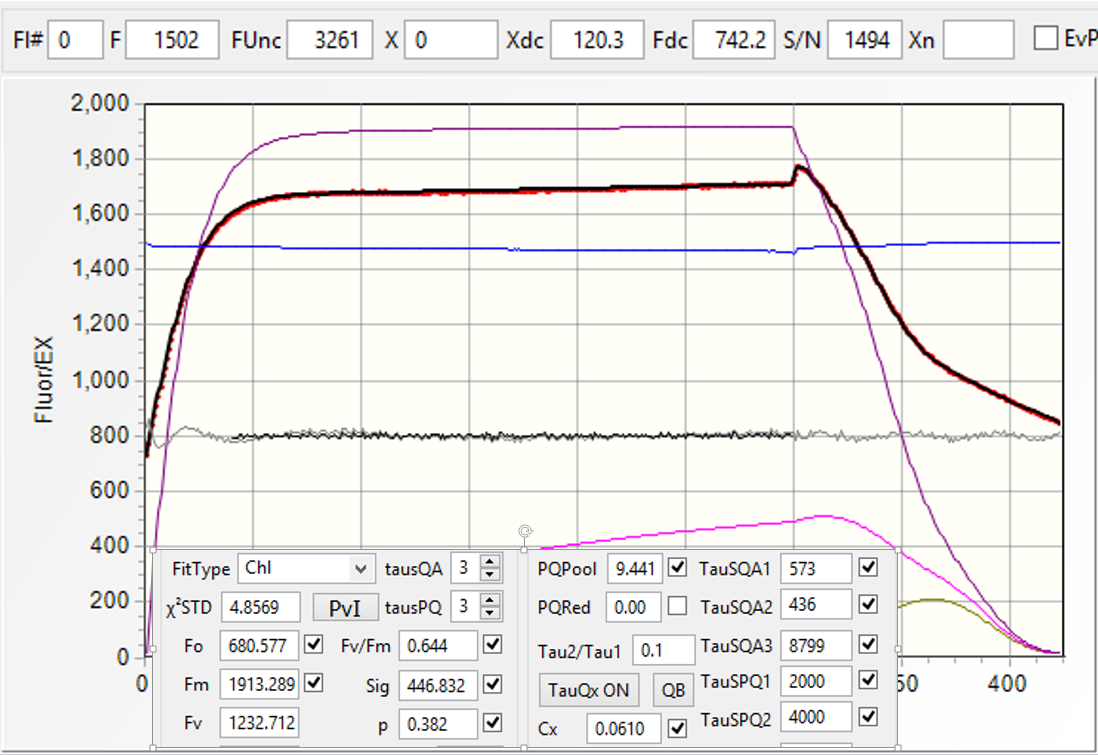
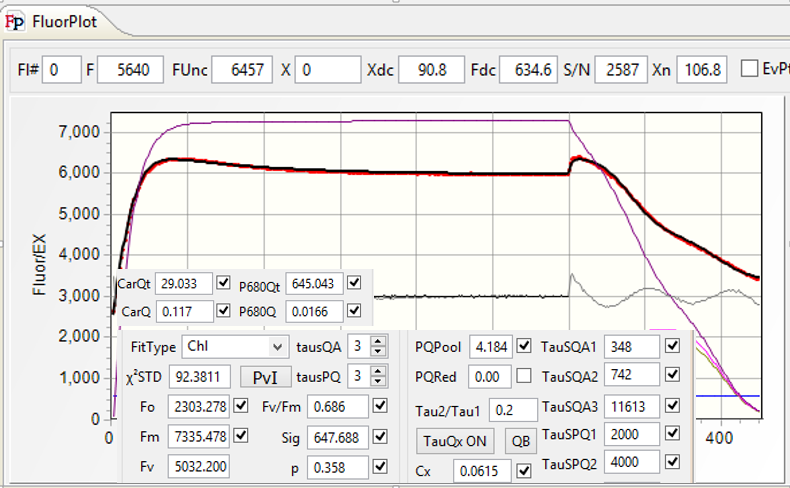
Once the SQA portion of the excitation protocol is completed, the time interval between flashlets is increased in an exponential fashion to observe the kinetics of QA reoxidation (the RQA portion of QA flash). This kinetics defines the shape of the fluorescence relaxation curve, and can usually be expressed as a sum of two, three, of four exponential components. This interpretation, however, doesn't reflect the biophysical nature of the electron transport phenomenon. Instead, we express this kinetics in terms of a multistage, sequential electron transport: QA → QB, QB → PQ pool, and PQ pool → PSI. We assume that two electrons can be stored on QB, and we allow the software to calculate the actual size of the oxidized portion of PQ pool. We allow for the back-reaction between QB and the donor side of PSII, generally with time constant of about 300 ms, and calculate the amplitude of the hypothetical charge recombination signal, assumed to be proportional to the level of QB reduction. As there is a number of free parameters in our fitting procedure, a question arises regarding the robustness of the analysis with so many degrees of freedom. To address this question, the user have a choice of including/excluding any of these parameters from the analysis, or fixing any of these parameters at an arbitrary level, thus reducing the degree of freedom in the fitting procedure. The quality of the fit can then be judged from the χ2 measure, and from the graphical representation of the fit residuals. Here we present an example of data analysis using high-quality fluorescence transient (S/N > 3000), at varying levels of degree of freedom.

  • Assume single-stage electron transfer between PSII and PSI.
    Although the time constant of this transfer, about 5 ms, is reasonable, the quality of the fit, judged from high χ2 =2964, and from large residuals, is inadequate. The purple trace in the plot show the calculated level of QA reduction.
  • Assume double-stage (QA → PQ pool → PSI electron transfer.
    The fit quality is a little bit better, with χ2 = 1034, and slightly better distribution of residuals. The brown trace display the calculated level of PQ pool reduction.
  • Assume three stage, QA → QB→ PQ Pool→ PSI electron transport model.
    The quality of the fit increased dramatically (χ2 =48.7), with much better distribution of residuals. Nevertheless, closer analysis of residuals reveals that the model has some problems at the initial stage of the saturation sequence, and in the relaxation portion (Remember that the residuals are amplified by a factor of 5)
  • Allow for back reaction.
    There is small improvement in the fit quality (χ2 = 32.1), but distribution of residual remains similar.
  • Make the probability of energy transfer a free parameter in the fit.
    There is virtually no change in the quality of the fit, indicating that the assumed arbitrary vale of 0.2 was a quite good guess for this parameter.
  • Allow calculation of charge recombination between QB and the donor side.
    The value of χ2 decreased to 21.9, with slight improvement of the residuals distribution. Adding other parameter to the fit (donor side quenching, making the time constant of back-reaction free, changing the initial level of PQ pool reduction) didn't improve the quality of the fit. A relatively high value of χ2 indicates that our model, not the quality of data, limits the quality of the fit.
Much different situation is arises under conditions of low S/N ratio. The same signal, attenuated by a factor of 12 , is recorded with S/N ratio of about 200. When analyzed with the same model, if produces χ2 of 1.14 , indicating a close to optimal fit. In this case, the S/N ratio, not the model quality defines the limits of the fitting procedure. On the other hand, such a low value of χ2 may indicate too many degrees of freedom under given S/N ratio. Replicating the measurement several times and observing the repeatability in the recovered parameters should allow verifying if that is the case.


Probability of Energy Transfer
This parameter describes a probability that excitation energy can be shared between reaction centers.
It allows the excitation energy acquired by antenna pigment associated with a currently closed reaction center to be transferred to another, still open reaction center and to initiate charge separation there. Presence of energy transfer increases the efficiency of photosynthetic light utilization at low-to-moderate irradiance levels.
In so called "lake" model with reaction centers distributed evenly within a common, homogenous array of light harvesting pigments, this probability may be relatively high. In a "puddle" model, with heterogeneous aggregates of pigments arranged around reaction centers, this probability should be much less. The actual pigment-RCII organization is more complex, with some light harvesting complexes closely associated with PSII core (CP43, CP46), enclosed by less tightly bound complexes (CP24, CP26, and CP29) and finally by the peripheral LHCII-M and LHCII-S complexes. This architecture functionally resembles local islands of pigments arranged to funnel excitation energy toward reaction center, submerged in a sea of less RCII-centric pigment complexes, capable of inter-RCII communication. The resulting probability of energy transfer ranges from low to moderate (0.2-0.45). Whatever the model, presence of energy transfer manifest itself as a departure of fluorescence saturation curve from the first-order characters to a sigmoidal shape. It affects calculation of the photochemical quenching and the functional absorption cross section, as well as the assessment of kinetics of electron transport. To properly calculate these parameters the probability of energy transfer needs to be included in the LIFT/FRR fitting procedure. The fluorescence transient with relatively high probability of energy transfer of 0.38 fits well when allowing for calculation of this parameter, with χ2 = 3.3. Fitting the same transient with p forced to zero (absence of energy transfer), yields highly unsatisfactory fit with χ2 = 77.6 and rather messy residuals. Also, all the calculated parameters change their values, with σ PSII and the kinetics of electron transport affected the most.
The observed probabilities of energy transfer in leaves of higher plants range from 0.2 to 0.4 at low irradiance levels, but decrease at moderate to high irradiances. This decrease is most likely caused by development of non-photochemical quenching, NPQ. High NPQ values promote thermal loss of excited states in antenna as they traverse from one reaction center to another. Hypothetically, this phenomenon represents one of the mechanisms by which NPQ lowers excitation pressure under high irradiance levels.

Size of the oxidized portion of PQ pool (PQox)
PQ pool (PQ) is a mobile pool of plastoquinone within thylakoid bilayer that mediates electron transport between QB component of PSII and cyt bf complex by a mechanisms of "long distance" (few hundred nm) electron shuttle. The size of the PQ pool ranges from 5 to 10 quinones per reaction center. The time constant of this electron transport, 5 ms to 20 ms, defined by the rate of lateral diffusion PQH2, and oxidation at Qo site of cyt bf represents a limiting step of electron turnover time. Both the size of the oxidized portion of PQ and the time constant of PQ reoxidation can be calculated from the kinetics of relaxation of the fluorescence transient (See how).
An example of a fluorescence transient acquired on a lemon tree leaf pre-illuminated by 30 seconds with 35 μmol quanta m-2s-1 of IR (730 nm) light displays a calculated level of PQox = 9.4, with relatively good fit quality of χ2 = 4.85. With the PQox forced to 1 (single plastoquinone, no "pool" present), the fit quality decreases dramatically, with χ2 increasing to 180, and highly unreasonable residuals, especially in the relaxation portion of the transient. Following 20 seconds of dark adaptation, the calculated PQox decreases to 6.6, possibly due to inflow of respiratory electrons into the PQ pool. Again, the fluorescence transient cannot be adequately fit without accounting for presence of the PQ pool. Within the next 60 seconds of dark adaptation the calculate size of PQox decrease to 2.93, indicating further reduction of PQ pool.

The level of PQ pool reduction can easily be manipulated by application of ambient illumination. By the same token, FRR excitation signal will also modify PQox (the entity to be measured). To assess this effect, a sequence of 12 FRR flashes was applied at 1 second interval on IR pre-illuminated lemon tree leaf with PQox quantified at each flash. Indeed, the measured PQox decreased from 6.97 to 3.1, with about 3% decrease after the first flash. Therefore, assessment of PQox should be performed using QA flash with as little excitation energy as practically possible to minimize the flash-induced inflow of electrons to the PQ pool.
When LIFT-FRR flashes are applied in a quick sequence under conditions of low (less that 1 μmol quanta m-2s-1 of white/IR light), the amplitude of fluorescence signal progressively increases, roughly in proportion to the level of PQ pool reduction (see the Charge Separation Section above). Ultimately, at close-to-full PQ pool reduction level, the amplitude of the measured fluorescence signal approaches that observed in the presence of DCMU. Because in the latter case the PQ pool reduction relevel should remain low, it is hypthesized that the occupancy level of QB site on D1 protein is the ultimate factor controlling the observed changes in the fluorescence signal. With increasing level of PQ pool reduction the quinone/hydroquinone equilibrium in the PQ pool shifts toward the latter, the fraction of un-occupied QB sites decreases, the electron residency time on QA increases, and the fluorescence yield increases to a level observed in presence of DCMU. Although the mechanisms by which the QB site un-occupancy (or electron residency time on QA) produces up to 40% increase in the fluorescence signal (up to 100% increase in terrestrial plants) remains unclear, it is likely that this mechanisms is also responsible for modulation of fluorescence signal during PQ flash compared to that of the QA flash (see the section on excitation protocols in the LIFT-Terrestrial section).

Carotenoids quenching (CarQ)
Carotenoid quenching develops under condition of high excitation power, typical of the saturation portion of the QA fluorescence transient.
CarQ quenching , when present in the fluorescence transient, dissipates within time-scales of 20-60 µs upon removal of excitation light. This kinetics is 1-2 orders of magnitude faster than the kinetics of QA re-oxidation, resulting in a characteristic bump in the fluorescence transient upon entering the relaxation phase of QA flash. As the excitation energy decreases by a factor of 10-20 in the relaxation phase, CarQ dissipates quickly while QA still remains mostly reduced, with fluorescence signal transiently recovering to a value representative of the actual level of QA reduction. Besides affecting the amplitude of observed fluorescence signal, presence of CarQ changes the shape of fluorescence relaxation curve, particularly within the first 100-200 µs of RQA. Fitting fluorescence transient without accounting for the presence of CarQ produces unsatisfactory fit with high values of χ2 = 590, and unacceptable distribution of residuals, particularly at the beginning of the relaxation phase, resulting in wrong estimates of the fitted parameters. By allowing for CarQ fit the quality of the fitting procedure increase significantly (χ2 = 9.5), with reasonable residual distribution and better estimates of calculated parameters.

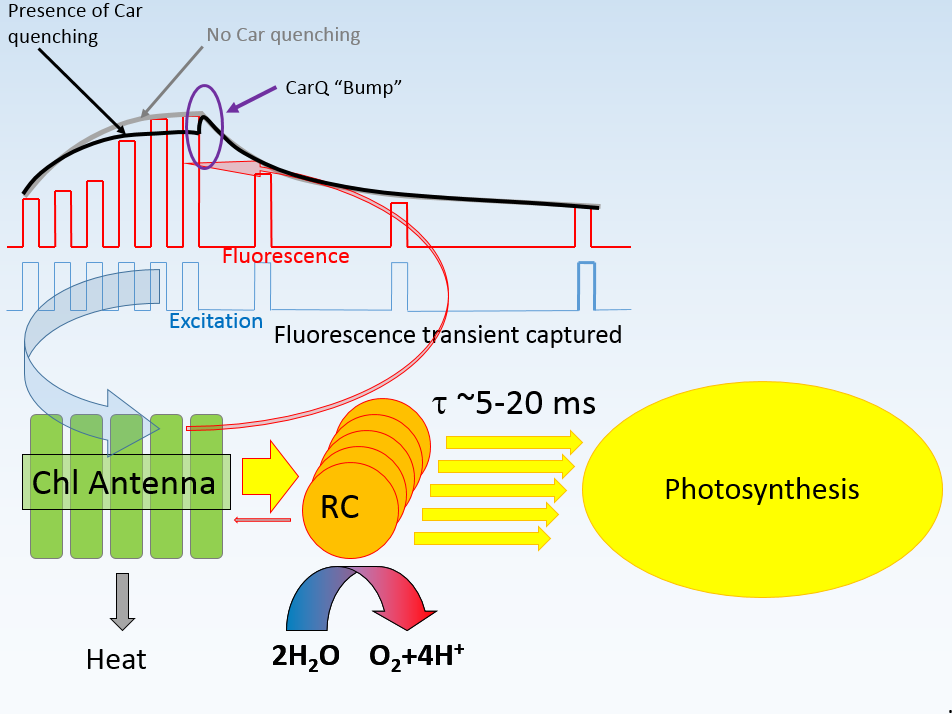
The CarQ is characterized by two parameters: the time constant of dissipation (in the transient shown, it equals 18 µs), and by the amplitude relative to the excitation power. LIFT-FRR software allows CarQ fitting using three different models:
  • Assuming that the amplitude of CarQ is controlled by the excitation power alone
  • Assuming that the amplitude of CarQ is controlled by the level of QA reduction
  • Assuming that the amplitude of CarQ is controlled by the product of excitation power and QA reduction level
At present, we cannot discriminate between these three models. The calculation example presented here is based on the first assumption.
NOTE: Both the amplitude and the time constant of the phenomenon described here may provide information about the functioning of the photosynthetic apparatus. Also, it may be of some importance regarding the photosynthetic performance of the organisms. It's emergence at high excitation power suggests a possible role in photoprotection. It is observed in both terrestrial and marine organisms, and the amplitude and time constant of this quenching appears to decrease with increasing growth irradiance.

Donor side quenching (P680+Q)
Donor side quenching is observed under conditions of very high excitation power, about 4 times higher than required for emergence of carotenoid quenching. It manifests itself as a decline in the fluorescence transient curve following the initial saturation phase. The dissipation time constant of this quenching, 400 - 600 µs, roughly corresponds to the average advance time of the S1 → S2 → S3 → S4 cycle at the donor side of PSII. Besides of the characteristic fluorescence decline, P680+Q presence manifests itself as blunt bump at the beginning of the relaxation portion of the QA flash. This bump is considerably wider compared to the presence of CarQ alone due to about an order of magnitude longer dissipation time.
Donor side quenching, when present and unaccounted for in the fitting procedure produces an unsatisfactory fit (χ2 ~ 2340 in the transient shown), with unacceptable distribution of residuals. When the donor side quenching is accounted for in the fitting procedure, χ2 decreases to 56, and the fit residuals improve significantly. The mechanistic relationship of the observed phenomenon with the donor side operation can be observed in a sequence of 10 flashes applied on a dark-adapted lemon-tree leaf. Although the first flash doesn't show P680+Q presence due to dark-induced reduction of PQ pool (an effect discussed earlier in the Φ PSII section), there is a distinctive, 4-cycle oscillation in the first few flashes. The amplitude of the fluorescence signal is related to the extent of P680+Q as judged from the initial slope of fluorescence decline due donor side quenching (see the blown-up transient) . Preliminary experiments performed with drying maple tree leaf indicate that the presence of this quenching may be related to the water stress.

NOTE: Observation of the donor side quenching in leaves of higher plants requires average excitation power of ~30,000 to 50,000 µmol quanta m-2s -1. In marine phytoplankton this quenching is observed at much lower excitation power due to average 2-3 times higher functional absorption cross section.

Photosynthetic Responses (PS)

Rapid Light Curves (RLC) and Instantaneous Light Curves (ILC)
Rapid Light Curves are acquired by recording fluorescence signals (mostly Fv/Fm) under increasing irradiance levels and fitting this signal to a model describing relationship between irradiance and electron transport rates.
LIFT-FRR instrument allows performing RLC experiment in a pre-programmed fashion, with user-selectable light steps and timing regime (A). The acquired signal is fitted to a hyperbolic or exponential model to calculate the initial slope, the E k, and the saturation level of electron transport rates (B). Another approach, called Instantaneous Light Curves (ILC) uses the fluorescence-derived parameters (functional absorption cross section, yield of charge separation, and the kinetics of photosynthetic electron transport) derived from a single fluorescence transient (C) to model the response of photosynthetic apparatus to increasing light levels. The ILC calculations are identical to the LIFT fitting procedure with the only difference of producing a steady-state solution at each "light level", while the LIFT calculations are performed under conditions of non-equilibrium between the rates of excitation delivery and electron transport (D).

To a first degree, the ILCs and RLCs should provide a similar relationship between irradiance and rates of electron transport. There is, however, a basic difference in these two approaches. RLCs are generally acquired over a period of several minutes at gradually increasing light levels, usually starting with a dark-adapted sample. As the organism experiences increasing irradiance regime, the operation of the photosynthetic machinery changes. The most dramatic is the decrease in the time constants of electron transport from the PQ pool to PSI, displaying up to 300% faster rates of electron transport at moderate-to-high irradiance levels compared to the dark-adapted sample. Therefore, measurement of the initial slope of the RLC curves is performed under conditions of "slow" electron transport, while measurement at high irradiance levels is performed under conditions of "fast" electron transport. Additional changes include buildup of non-photochemical quenching and photoinhibition and the end of RLC experiment. In contrast, ILC measurements represent a snapshot of photosynthetic performance under actual light conditions. ILC measurements are completed within 50-200 ms, allowing these curves to be acquired in in real-time under highly dynamic conditions of natural illumination. Despite these differences, there are conditions where RLC and ILC approach produce similar results. The most important is avoidance of prolonged dark adaptation prior to RCL measurements, or better yet, allowing adaptation to a low level (5-10 µmol quanta m-2s -1) background irradiance followed by no more than 5 seconds of dark adaptation prior to RLC measurements. An example data set, with RLC acquired over a period of 10 minutes, and ILC acquired over a period of 200 ms with low-light adapted marine diatom D. brightwellii show almost identical results.


Assessment of State Transition
Assessment of state transition is usually performed in a presence of low-level, ~ 20 µmol quanta m-2s -1 blue light (shift toward State II), with periods of superimposed infrared light (return to state I).
The presence and the extent of State Transition is usually assessed from changes in the fluorescence yield following application of the illumination protocol described above. Using LIFT-FRR approach, State Transition can also be quantified from parallel changes in the functional absorption cross section, while continuously monitoring the oxidized portion of the PQ pool. Once the signal stabilizes in darkness, application of blue light results in a quick (few seconds) reduction of PQ pool, and about 20% increase in both Fo and Fm signals, followed by a gradual decline in the fluorescence yield and the functional absorption cross section, indicative of translocation of about 10-15 % of PSII antenna toward PSI. PQ pool gradually oxidizes as the balance of excitation energy shifts from PSII to PSI. Addition of IR (730 nm) light quickly oxidizes PQ pool, reversing this trend.

The ability to perform such measurements in vivo, with a time resolution of single seconds, should allow assessing and quantifying the physiological significance of the State Transition under natural environmental conditions. The State Transition experiment presented here was performed on young Parsley plant.